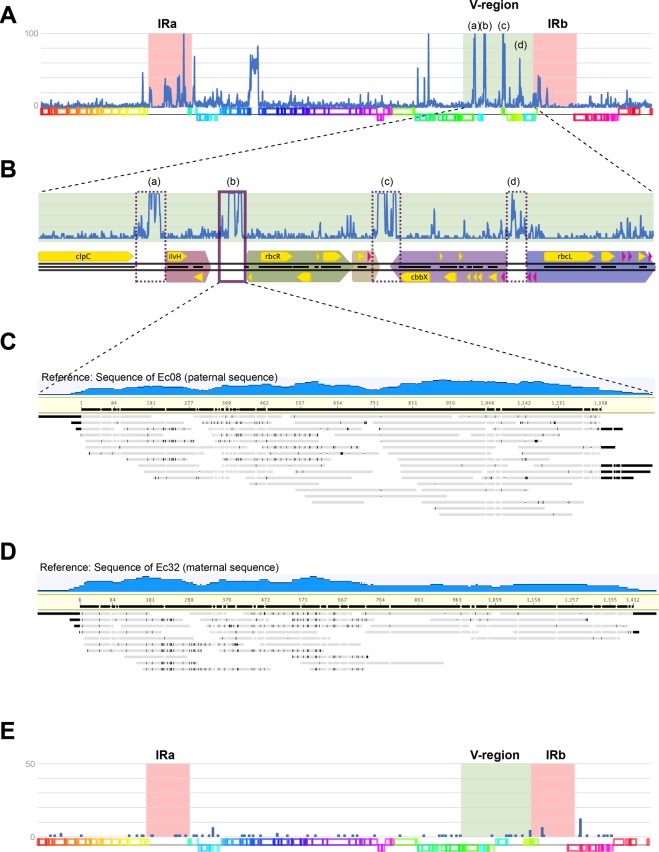
Figure 4.
Nucleotide substitution rates per site between ptDNAs of two Ectocarpus species. (A) Nucleotide substitution frequency (counts per each window) between ptDNAs of two species of E. siliculosus plotted on the full ptDNA sequence. The window size is 100 bp and the maximum value is 100. There are several peaks of high variability especially in the IRs and the V-region. Four major peaks: (a) to (d) in the V-region are magnified in panel B. (B) Each peak corresponds to the flanking region of a syntenic block described in Fig. 3 (violet boxes). (C,D) Biparental inheritance of ptDNA was confirmed by mapping sequence reads from a hybrid onto region (b) of the parental ptDNA sequences. (E) Nucleotide substitution plot between male and female Sc. promiscuus individuals from the same population. The window size is 100 bp and the maximum value is 50. There were few substitutions between the two individuals.

