Figure 2.
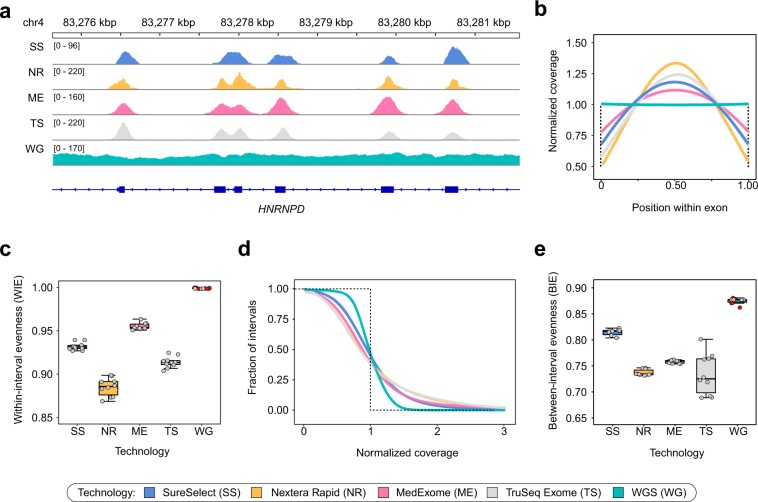
Different technologies exhibit specific patterns of coverage within exons and differ coverage distribution within exons. For all plots, a subset of samples was used as described earlier. (a) Example of sequencing coverage patterns across exons of the HNRNPD gene. Selected samples with similar mean CDS coverage are shown. (b) Distribution of relative coverage from the start to the end of target interval, averaged over all CDS regions. (c) Within-interval coverage evenness (WIE) values calculated from distributions shown in (b) (see Methods for more details; all capture technologies differ in pairwise U-test with Holm-Bonferroni FDR correction (adjusted p-value < 0.001)). (d) Distribution of normalized mean coverage across CDS intervals. As in Fig. 1, dotted line represents ideal case baseline. (e) Between-interval coverage evenness (BIE) values derived from normalized coverage curves shown in (d). Red points indicate WGS samples obtained from open sources, while grey points represent our dataset.

