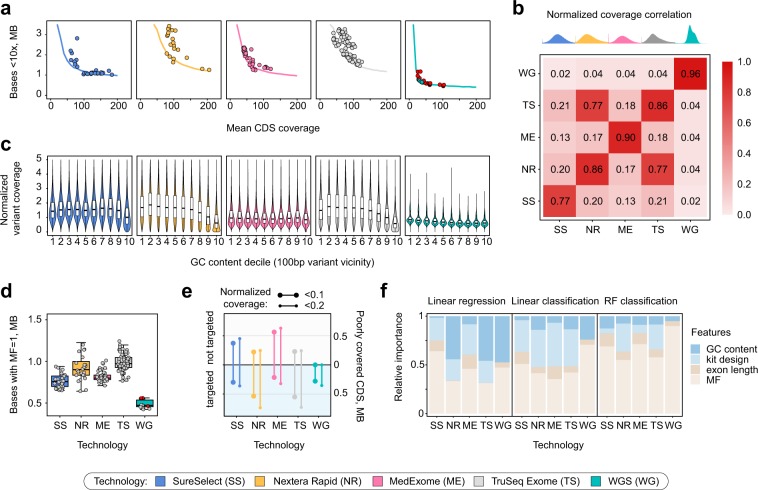
Figure 3.
Modeling of CDS coverage identifies key determinants of coverage evenness. (a) A model based on normalized coverage patterns suggests existence of coverage limits for each technology. Solid lines correspond to model predictions of the amount of bases covered <10x depending on mean CDS coverage. Dots are samples analyzed in the study. (b) A heatmap showing average correlation between mean coverages for each exon. Distributions on top are distributions of per-interval normalized coverages. (c) GC-bias of coverage at variant sites with different GC-content of 100 bp vicinity (median GC-content in each bin: 0.33, 0.38, 0.42, 0.45, 0.49, 0.53, 0.57, 0.61, 0.65, 0.71). (d) Comparison of the amount of CDS bases covered only by multimapping reads for each technology. (e) Total length of targeted and not targeted CDS regions with reproducible low (<0.1 or <0.2 average) normalized coverage. (f) Relative importance of different exon features for prediction of exon coverage using linear regression (left), linear classification (middle), or random forest classification (right; see Methods for the details of importance calculation). Red points in panels (a,d) indicate WGS samples obtained from open sources, while grey points represent our dataset.

