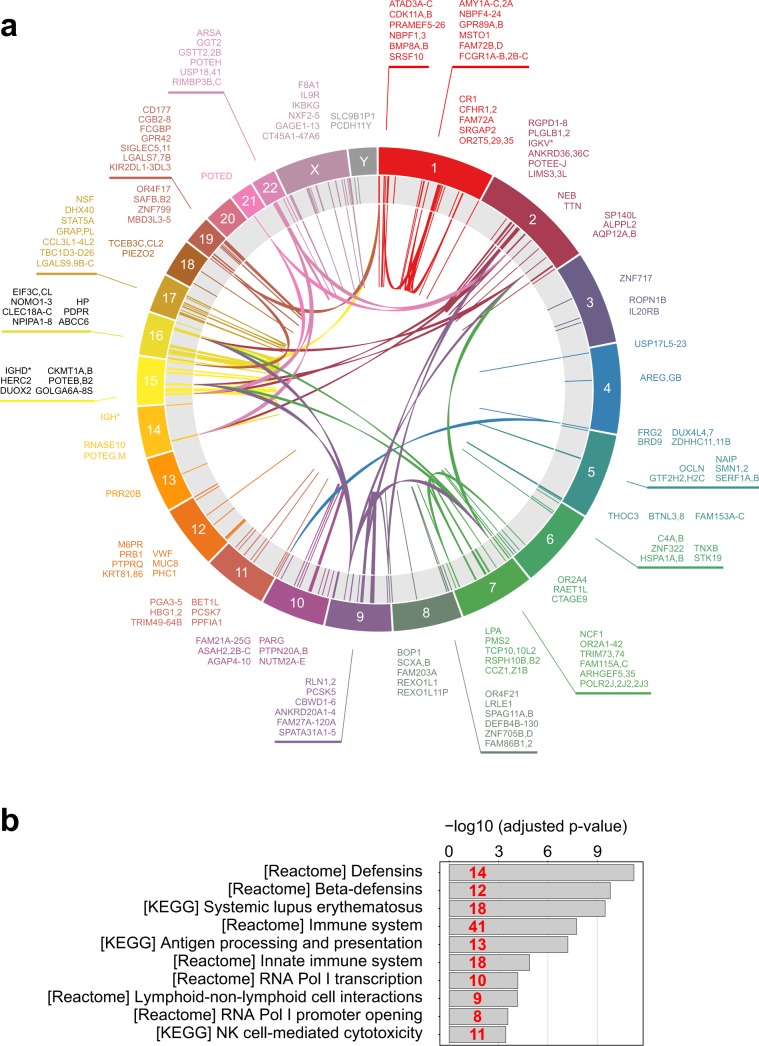
Figure 4.
Summary of repetitive human CDS regions inaccessible by current WES and WGS technologies. (a) Circa diagram showing cross-mappability of CDS regions. Only a subset of clinically relevant genes is shown to decrease diagram complexity. (b) MsigDB enrichment analysis of genes with CDS regions having MF > 0.4 using canonical pathways (CP) list. Top-10 significant hits are shown. Numbers in red indicate the number of genes in each overlap.

