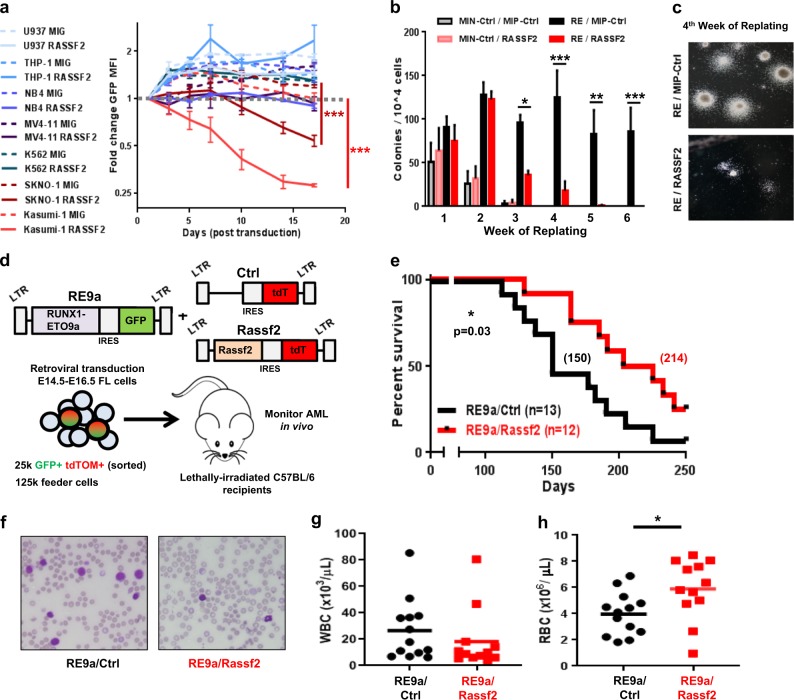
Fig. 3. Re-expression of RASSF2 is tumor suppressive specifically in t(8;21) AML.
a Fold-change in population mean GFP fluorescence intensity (MFI) over time was measured by flow cytometry in the indicated cell lines following transduction (efficiencies ~50–60%) with retroviral MSCV-IRES-GFP (MIG), or MSCV-RASSF2-IRES-GFP (RASSF2) vectors. Data are mean ± s.e.m. of four experiments. ***p < 0.001, two-tailed Student’s t-test performed at day 17 for cell lines in which GFP MFI of one vector-transduced population dropped below initial measurement value (day 1 post-transduction), which is indicated by dashed gray line. b Number of colonies (per 10,000 plated cells) for each week of serial replating of primary murine bone marrow cells transduced with vectors as indicated. Data are mean ± s.e.m. of five experiments. *p < 0.05, **p < 0.01, ***p < 0.001, two-tailed Student’s t-test. See also Supplementary Fig. 2b. c Representative images of colonies from fourth week of replating (b) for indicated populations. d Schematic for primary RUNX1-ETO9a retroviral transduction/transplantation murine model of t(8;21) AML with re-expression of Rassf2 (RE9a/Rassf2) or vector control (RE9a/Ctrl). e Survival analysis for experiment described in d; significance determined by log-rank (Mantel-Cox) test. f Representative peripheral blood smears of indicated mice from experiment described in d at 125 days post-transplantation. g, h Peripheral (g) white blood cell (WBC) and (h) red blood cell (RBC) counts of indicated mice from experiment described in d at 125 days post-transplantation, solid lines indicate population mean. *p < 0.05, two-tailed Student’s t-test.

