Figure 3.
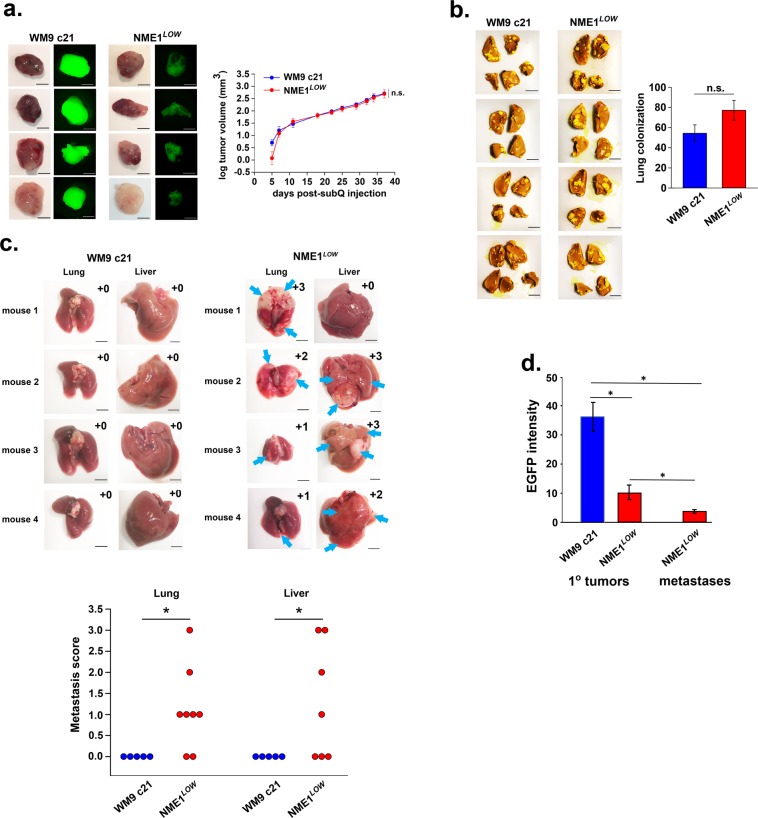
NME1LOW subpopulations derived from human melanoma cell lines exhibit unaltered growth as primary tumor xenografts but are highly metastatic from a primary tumor location (spontaneous metastasis). (a) Shown at left are representative color and EGFP fluorescence images of subcutaneous tumor xenografts obtained in NSG mice from parental WM9 clone 21 (n = 12) and the corresponding NME1LOW subpopulation (n = 13). Scale bar: 5 mm. Tumor growth rates of the two cell lines are summarized at right (mean ± SEM). n.s., non-significant by t-test. (b) The NME1LOW subpopulation is unaltered in its ability to colonize lung tissue following injection via the tail vein (experimental metastasis). Injections were performed in NSG mice with cells (105) from the parental WM9 clone 21 (total n = 8) or the corresponding NME1LOW subpopulation (total n = 9). Representative images of lungs stained with Bouin’s fixative are shown at left. Scale bar: 5 mm. Lung colonization activity (right panel) was quantified as a composite score based on total number and size of visible metastatic lesions (Methods). n.s., non-significant by two-tailed t-test. (c) NME1LOW cells metastasize aggressively to lung and liver from subcutaneous melanoma xenografts. Xenografted tumors in mice of panel (a) were surgically removed upon reaching a volume of 500 mm3, with mice sacrificed at 8 weeks post-surgery. Representative images of lungs and livers are shown in the upper panels, with composite metastasis scores (scale 0–4) are included within each panel. Dot plots displayed in the lower panel summarize metastasis scores obtained for all mice. Asterisks denote significant differences between groups, as analyzed by Mann-Whitney rank sum test (p < 0.05). (d) Quantification of EGFP intensity for primary and metastatic tumors. Asterisks denote significant differences between groups (t- test; p < 0.05).

