Figure 4.
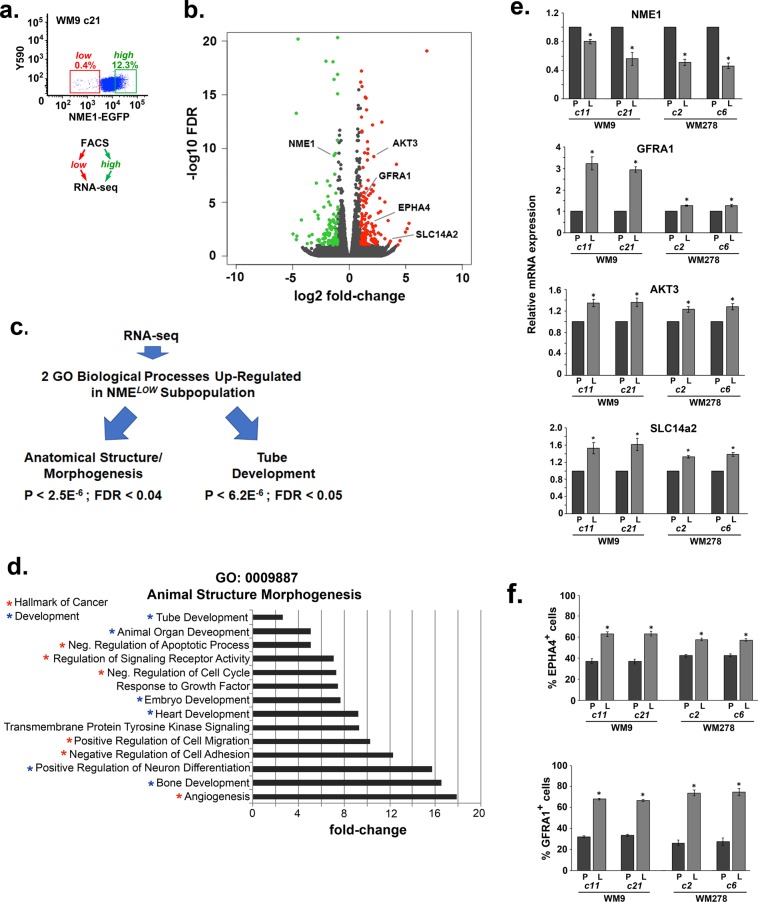
The NME1LOW subpopulation exhibits a gene expression profile consistent with a neural crest-like phenotype. (a) Isolation of NME1LOW and NME1HIGH subpopulations from WM9 clone 21 by FACS for RNA-seq analysis. (b) Volcano plot of mRNA expression in NME1LOW vs. NME1HIGH subpopulations. (c) Flow chart of steps involved in identification of two GO biological processes that were upregulated in the NME1LOW subpopulation. (d) Processes associated with the biological process anatomical structure/morphogenesis. Processes identified as “Hallmarks of Cancer” or associated with “Development” are highlighted with red or blue asterisks, respectively. (e) Validation of RNA-seq analysis across multiple NME1-EGFP-expressing clones. Steady-state expression of mRNAs encoding NME1, GFRA1, AKT3 and SLC14a2 was determined by qRT-PCR in the indicated parental clones (“P”) and NME1LOW (“L”) subpopulations. Asterisks denote significant differences between matched parental clone and NME1LOW (“L”) subpopulations, as determined by paired t-test (p < 0.05) (f) Inductions in expression of RNAs encoding EPHAA4 and GFRA1 are reflected in expression of the cognate cell surface proteins at the cell surface (p < 0.05, t-test).

