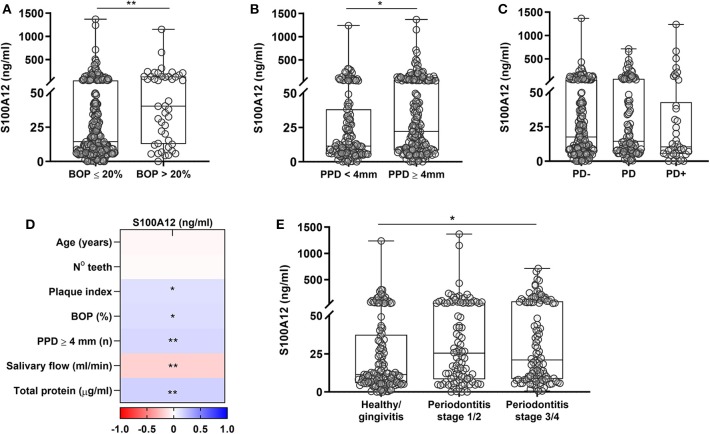
Figure 5.
Salivary levels of S100A12 in relation to periodontal disease. (A) S100A12 levels in saliva from participants having bleeding on probing (BOP) ≤ 20% (n = 292) and those having BOP > 20% (n = 44). (B) Salivary levels of S100A12 in participants having (n = 201) or not probing pocket depth (PPD) ≥ 4 mm (n = 135). (C) Levels of S100A12 in saliva from participants without bone loss (PD–; n = 175), with localized bone loss (PD; n = 103), and generalized bone loss (PD+; n = 44). Fourteen radiographs were missing. (D) Spearman correlation heat map between S100A12 and clinical parameters. (E) Salivary levels of S100A12 in healthy/gingivitis participants (n = 133) and those with periodontitis stages I/II (n = 95) or stages III/IV (n = 108). Data are presented as median and quartiles. Differences were calculated with Mann–Whitney test or Kruskal–Wallis with Dunn's post-hoc test, *p < 0.05, **p < 0.001.

