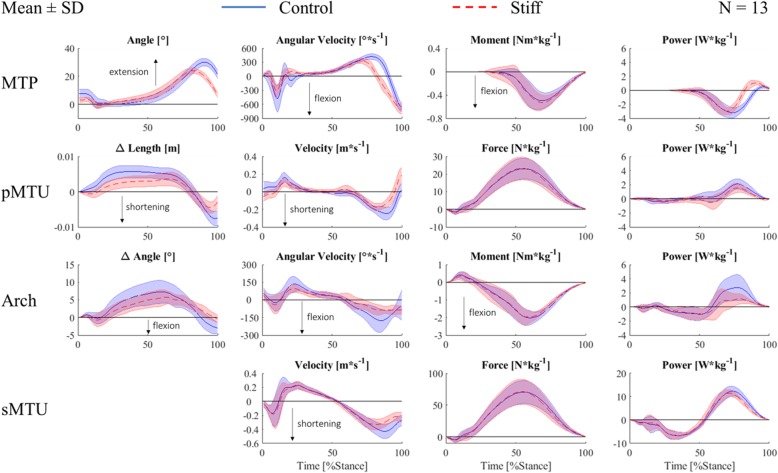
Fig. 3.
Group mean ± standard deviation (shaded area) of the metatarsophalangeal joint (MTP; first row), plantar muscle-tendon unit (pMTU; second row), arch (third row), and shank muscle-tendon unit (sMTU; fourth row) angle/length change (first column), (angular) velocity (second column), force/moment (third column), and power (fourth column) across the stance phase of running in the control (blue full line) and stiff (red broken line) conditions

