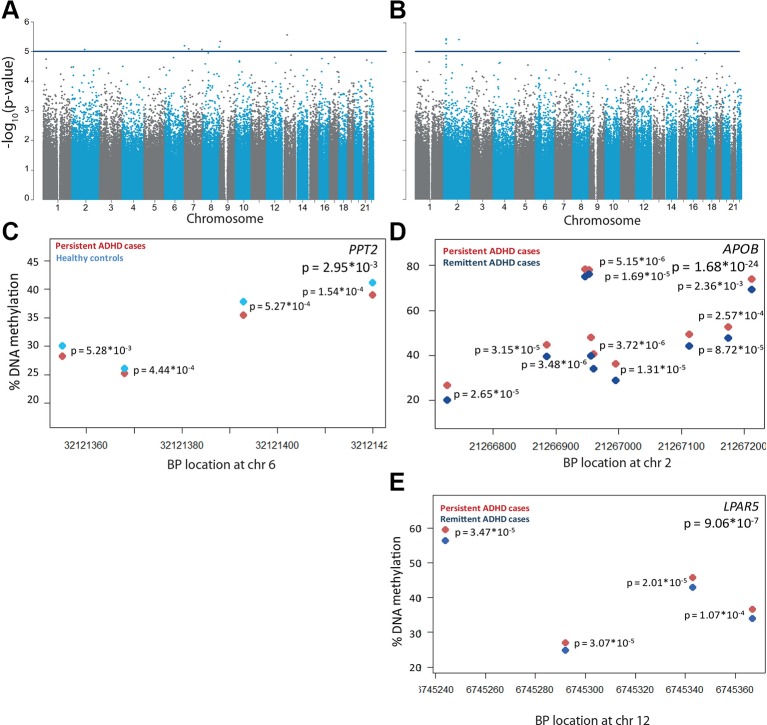
Figure 1.
Differential DNA methylation in persistent attention-deficit/hyperactivity disorder (ADHD). −log10(p-values) of the methylation sites are plotted along their chromosomal position for (A) n = 35 participants with persistent ADHD and n = 19 healthy controls and (B) n = 35 participants with persistent and n = 18 participants with remittent ADHD. The horizontal blue line indicates the nominally significance threshold of −log10(5). One differentially methylated region was found in (C) PPT2 for participants with persistent ADHD (red) compared to healthy controls (light blue). Differentially methylated regions were found in (D) APOB and (E) LPAR5 for participants with persistent compared to remittent ADHD (dark blue). Each circle represents a CpG site, of which DNA methylation levels are plotted for the corresponding chromosomal location. Individual p-values per CpG sites are located next to the site, and a combined p-value is given in the upper right corner.

