Figure 2.
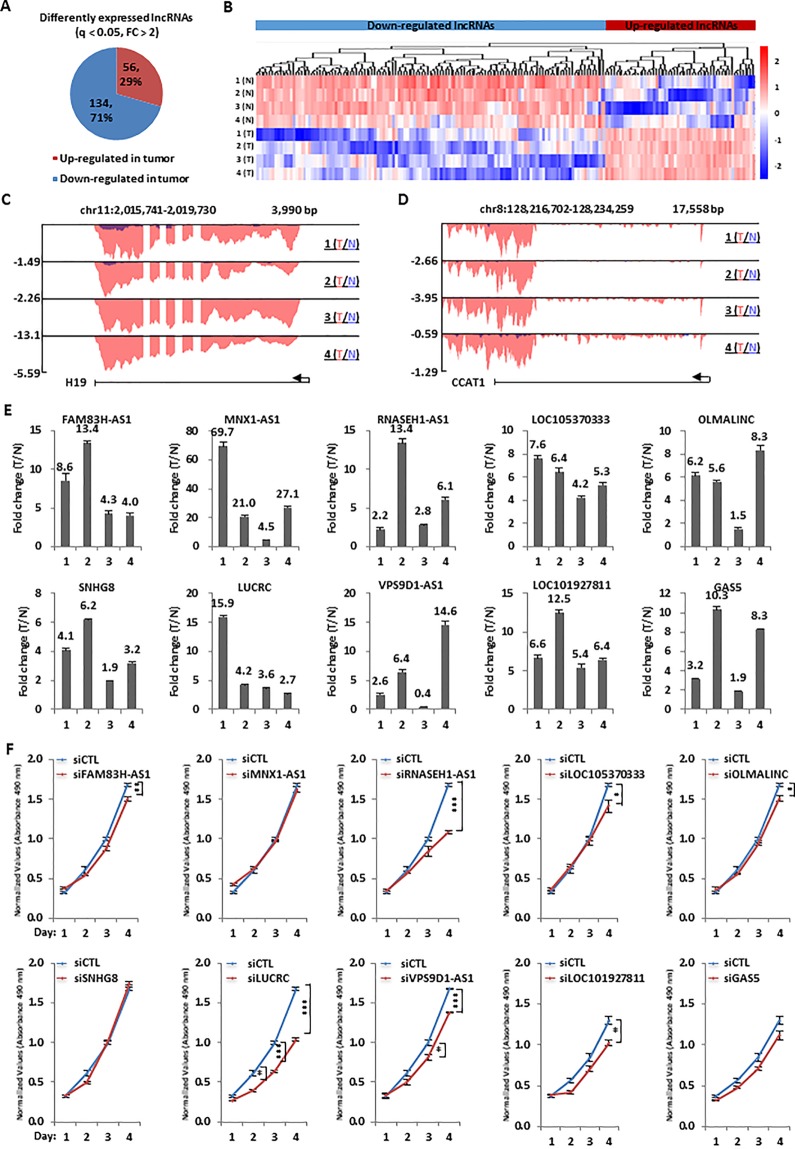
Hundreds of lncRNAs were dysregulated and a number of them were required for colorectal cancer cell growth. (A) Pie chart shows lncRNAs dysregulated, both up-regulated and down-regulated, in colorectal tumor samples as described in Figure 1A (q < 0.05, FC > 2). (B) Heat map representation of the expression levels (FPKM, log2) for dysregulated lncRNAs, both up-regulated and down-regulated, in colorectal tumor samples as described in (A). (C, D) UCSC genome browser views of RNA-seq as described in Figure 1A for specific up-regulated lncRNAs were shown as indicated. (E) RNA samples from four patients with colorectal cancer as described in Figure 1A were subjected to RT-qPCR analysis to examine the expression of 10 top-upregulated lncRNAs in colorectal tumor samples as detected by RNA-seq analysis. Data was presented as fold change of tumor (T) versus normal (N) as indicated (± s.e.m.). (F) HCT116 cells were transfected with control siRNA (siCTL) or siRNA specifically targeting each individual lncRNA for duration as indicated followed by cell proliferation assay. (± s.e.m., *P < 0.05, **P < 0.01, ***P < 0.001).

