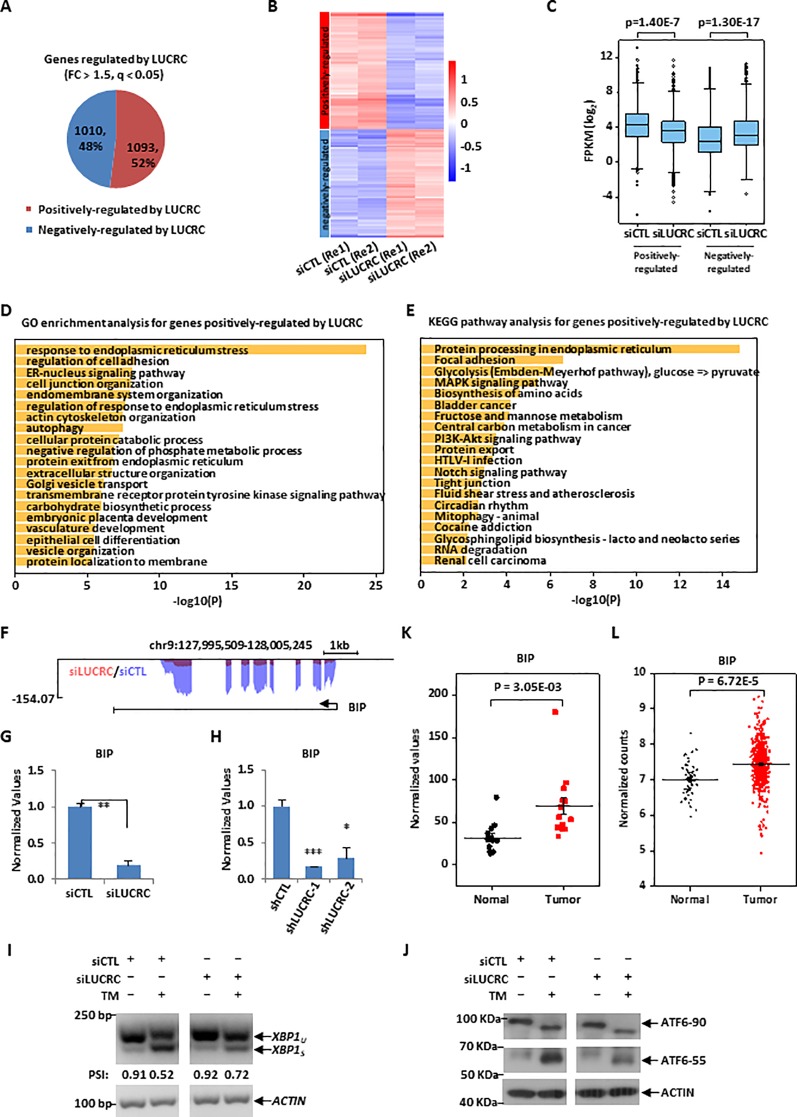
Figure 4.
LUCRC was required for the expression of genes involved in ER stress response, including BIP. (A) HCT116 cells transfected with control siRNA (siCTL) and siRNA specifically targeting LUCRC (siLUCRC) for 3 days were subjected to RNA-seq analysis, and genes positively- and negatively-regulated by LUCRC were shown by pie chart (Fold change (FC) > 1.5). (B, C) Heat map (B) and box plot (C) representation of the expression levels (FPKM, log2) for genes positively- and negatively-regulated by LUCRC in HCT116 cells as shown in (A). Re1: replicate 1; Re2: replicate 2. (D, E) GO (D) and KEGG (E) analysis for genes positively-regulated by LUCRC in HCT116 cells as shown in (A). (F) UCSC genome browser view of RNA-seq as described in (A) for BIP was shown. (G) HCT116 cells were transfected with siCTL or siLUCRC for 3 days followed by RT-qPCR analysis to examine the expression of BIP (± s.e.m., **P < 0.01). (H) HCT116 cells were infected with shCTL or shLUCRC for 3 days followed by RT-qPCR analysis to examine the expression of BIP (± s.e.m., *P < 0.05, ***P < 0.001). (I) HCT116 cells were transfected with siCTL or siLUCRC for 3 days and then treated with or without tunicamycin (TM) (1μg/mL) for 8 h, followed by RNA extraction, reverse transcription and PCR analysis using primers targeting XBP1 or ACTIN. Splicing of XBP1 was presented as PSI (percentage of inclusion: XBP1u/(XBP1u + XBPIs)). XBP1u: unspliced XBP1; XBP1s: spliced XBP1. DNA fragment size was indicated on the left. bp: base pair. (J) HCT116 cells as described in (I) were subjected to immunoblotting analysis by using antibodies as indicated. Molecular weight was indicated on the left. KDa: kilodalton. ATF6-90: full length ATF6; ATF6-55: partial ATF6. (K) Colorectal tumor tissues and the corresponding adjacent normal tissues were collected from a group of colorectal cancer patients (n = 14) and subjected to RNA extraction and RT-qPCR analysis to examine the expression of BIP (± s.e.m., **P < 0.01). (L) The expression of BIP in a cohort of clinical colorectal tumor (n = 647) and normal (n = 51) samples from TCGA (The Cancer Genome Atlas).

