Figure 3.
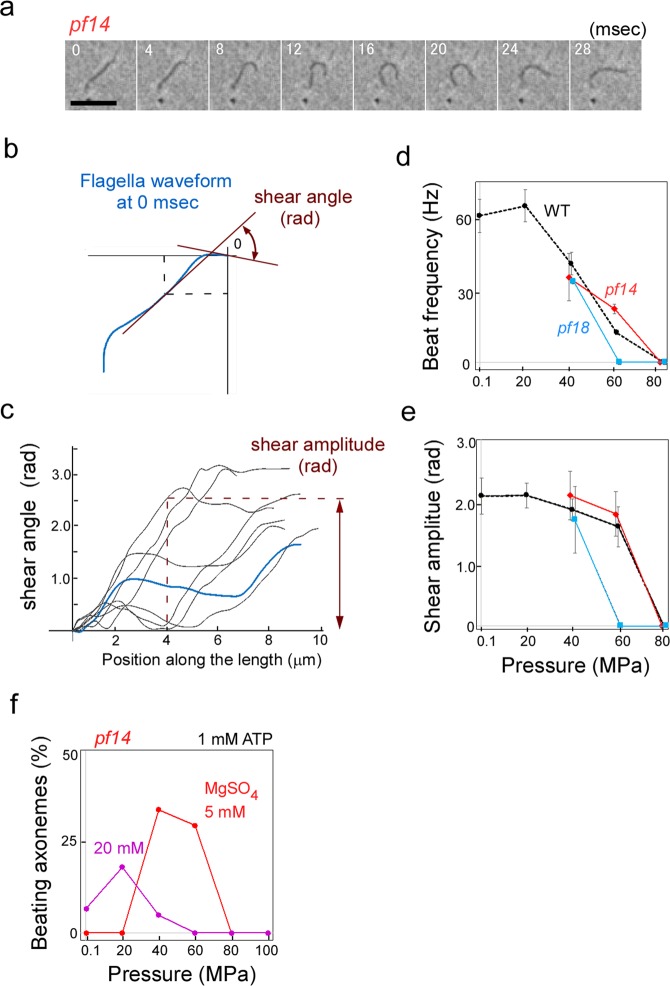
Reactivated motility of axonemes at high pressure. (a) Sequential photographs of a pf14 axoneme beating with an asymmetric waveform in the presence of 1 mM ATP and 1 mM.EGTA at 40 MPa. Temperature: 25 °C (b) A trace of waveform in (a). The angle between the tangents to the proximal segment (position 0, at upper right position) and multiple positions every 0.25 μm along the axoneme were measured. The angle (shear angle) is proportional to the sliding distance between doublet microtubules at each position50. (c) The shear angle at every 0.25 μm is plotted along the length of axoneme (shear curve). Shear curves for waveforms at different time points in (a) were overlaid; the shear curve at 0 ms is drawn in blue. Shear amplitude at 4 μm from the proximal end (indicated by the dashed line) is used for waveform comparison. (d,e) Beat frequency and shear amplitude in the beating axonemes of WT and pf mutants at different pressures. Mean ± SD were measured in 10 axonemes each for WT and mutants. Temperature: 25 °C. (f) Pressure-induced beating of pf14 axoneme at different MgSO4 concentrations. Optimal pressure for pf14 axonemes were lower at 20 mM MgSO4 than at 5 mM MgSO4. More than 50 cells were examined for each data point.

