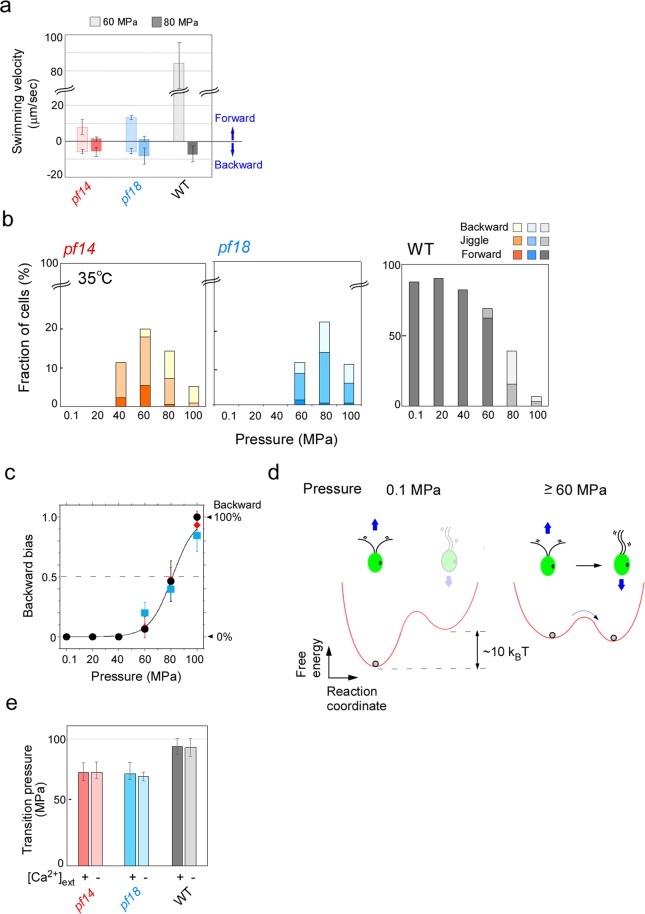
Figure 4.
Backward-swimming cells increase at high pressure. (a) Comparison of forward- and backward-swimming velocities in WT and pf mutant cells. Swimming velocities of more than five cells were measured under respective pressure conditions. Mean ± SD for more than five cells were examined in WT and pf mutants, respectively. Temperature: 35 °C. (b) The number ratio of forward-swimming, backward-swimming, and jiggling cells under high-pressure conditions for pf and WT cells at 35 °C. More than 50 cells were examined for each data point. Similar results were obtained at 15 and 25 °C (Fig. S3). (c) Increase in number of backward-swimming cells with the increase of pressure. Backward bias, nbackward/(nforward + njiglling + nbackward), was calculated, where nforward, njiglling, nbackward are the numbers of the cells in the forward, jiggling and backward swimming states, respectively. Data for cells whose flagella were stopped were excluded from the calculation. The mean ± SEM of three independent experiments were shown for pf14 (red), pf18 (blue), and WT (black). (d) Two-state equilibrium model of pressure-induced change of flagellar waveform. The forward-moving (asymmetrically beating) state and backward-moving (symmetrically beating) state would be in the equilibrium. At ambient pressure (0.1 MPa), forward-moving state is prevailing because its free energy potential is lower than that of backward-moving state. High pressure decreases the free-energy potential difference between the two states, and increases the number of backward-moving cells with symmetric beating pattern. Following a two-state model41, the backward bias is thermodynamically given by (1 + exp((ΔG + PΔV)/kBT))−1, where ΔG is standard free energy, P is pressure, ΔV is a pressure-dependence parameter (reaction volume), kB is the Boltzman’s constant, and T is temperature. The best-fit result was obtained with ΔG = 9.4 kBT, ΔV = −0.49 nm3 for pf mutant and WT cells (Solid line in c). A gray ball in the left figure indicates that all cells swim forward at atmospheric pressure. In contrast, two gray balls in the right figure indicates that, at high pressure (≥60 MPa), the two states are in equilibrium and that the number of cells moving backward increases with the increase of pressure (arrow). (e) The transition pressure (the pressure at which 50% of moving cells displayed backward swimming) for the three strains in the culture medium containing either 0.35 mM Ca2+ or 2 mM EGTA. Backward bias with or without Ca2+ was analyzed for more than 40 cells, as in Fig. 4b and 4c. The mean ± SEM of the transition pressure in three independent experiments were shown for pf14 (red), pf18 (blue), and WT (gray). All three strains showed almost the same transition pressure in the two media.

