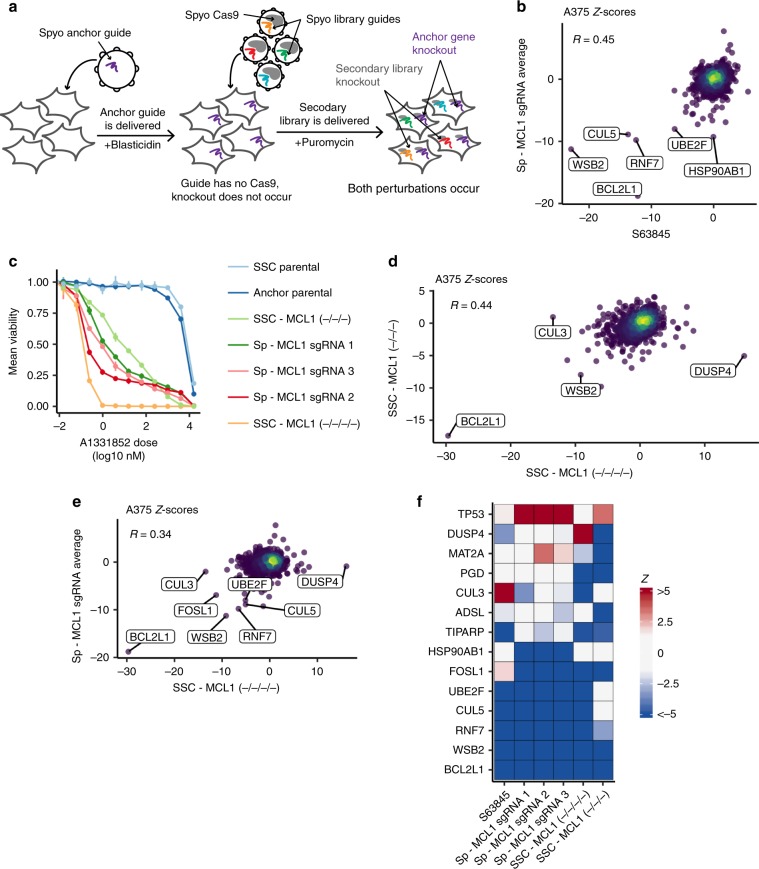
Fig. 4. MCL1 secondary screens comparing alternative screening approaches.
a Schematic of Spyo-only approach screened with the secondary library. Spyo anchor perturbation shown in purple, Spyo library perturbations shown in remaining colors. b Z-scores for MCL1 anchors, averaged across three guides compared to S63845 treatment, screened with a secondary library in A375 cells. Points are colored by density. Pearson correlation coefficient is indicated. Top six hits, ranked by average absolute Z-score across MCL1 guide conditions, are labeled. c Dose response curves for cells treated with A-1331852. Cells include two A375 parentals, two A375 MCL1 knockout clones, and three A375 MCL1 anchor knockouts. The line range represents one standard deviation for doses where multiple viability measurements were collected. d Same as b but for the MCL1 −/−/− knockout clone vs the MCL1 −/−/−/− knockout clone. Top two hits ranked by absolute average Z-score and top two differences between single-cell clone conditions are labeled. e Same as b but for MCL1 anchors, averaged across all guides vs the MCL1 −/−/−/− knockout clone. Top six and five hits ranked by absolute average Z-score for MCL1 guide conditions and the MCL1 −/−/−/− knockout clone, respectively, are labeled. f Heatmap of Z-scores for the top five hits from all secondary screens, ranked by absolute Z-score. Genes and screens are ordered by mean Z-score.

