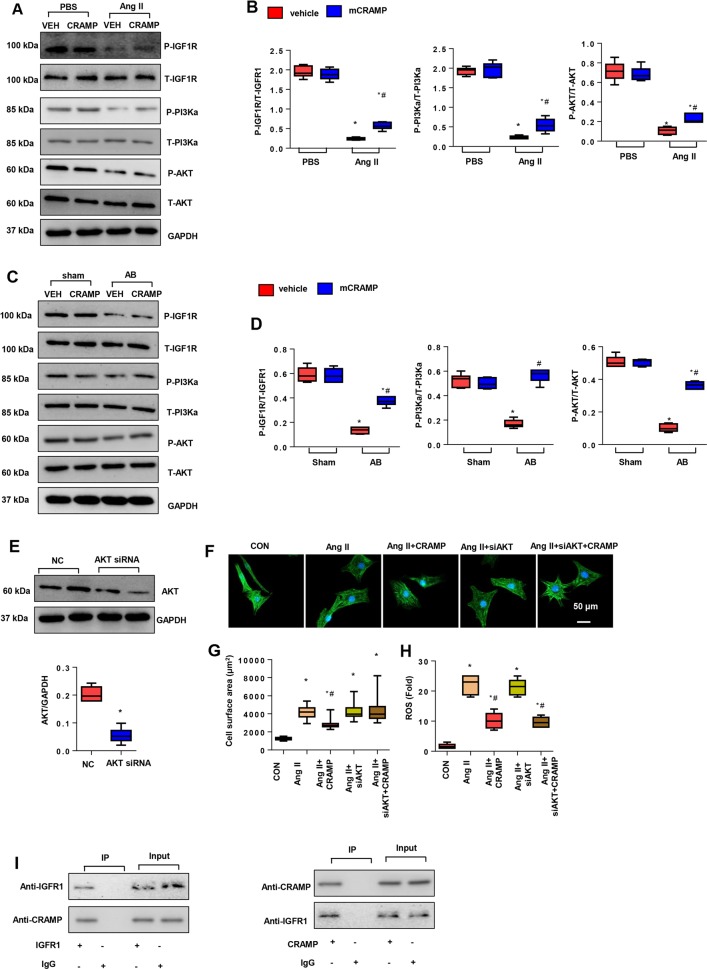
Fig. 6. CRAMP activated IGFR1/PI3K/AKT1 signaling.
a, b Protein levels of IGF1R, PI3K, AKT1 in NRCMs treated with mCRAMP (0.5 mg/L) and Ang II (1 μM) (n = 6). *P < 0.05 vs. vehicle-CON; #P < 0.05 vs. vehicle-Ang II. c, d Protein levels of IGF1R, PI3K, AKT1 in remodeling heart tissue treated with mCRAMP (n = 6, *P < 0.05 vs. CON-sham; #P < 0.05 vs. CON-AB). e–i NRCMs were transfected with AKT1 siRNA and treated with mCRAMP (0.5 mg/L) and Ang II (1 μM). e Protein levels of AKT1 in NRCMs (n = 6). f, g α-actin staining (n = 6) and cell surface area (n > 50 cells per group). h ROS levels (n = 6). *P < 0.05 vs. CON; #P < 0.05 vs. Ang II. i Co-IP experiment in NRCMs.

