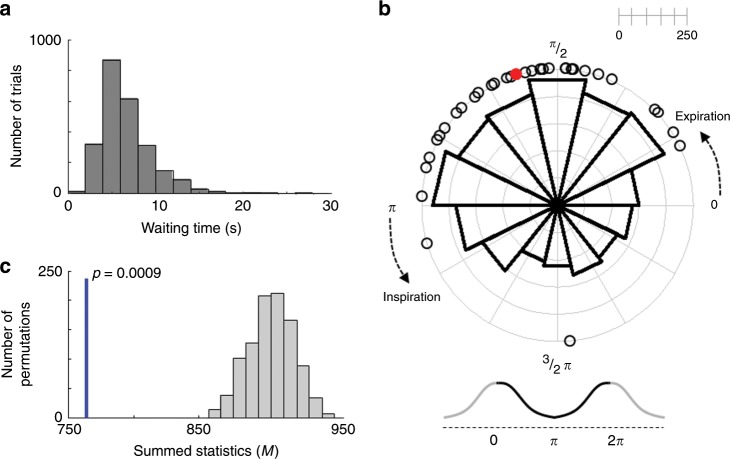
Fig. 2. Coupling between voluntary action and respiratory phase during the Libet task in Experiment 2.
a Distribution of waiting times (pooled across 32 participants) showed the typical rightward skewed shape. b Distribution of respiration phases with respect to the timing of voluntary action onset. Empty black circles represent each participant’s mean respiration phase at button press. Participants initiated voluntary actions more frequently during the expiration phase. The polar histogram shows the distribution of all the button presses from 32 participants, which was also concentrated in the expiration phase. The red dot indicates the grand-averaged respiration phase at button press. c The computed test statistics using original data (indicated by the blue vertical line) was significantly smaller than chance-level statistics obtained from phase shifted surrogate respiration data (indicated by the histogram; permutation p = 0.0009), showing the timing of button presses in Experiment 2 is coupled with respiration phase.

