Figure 2.
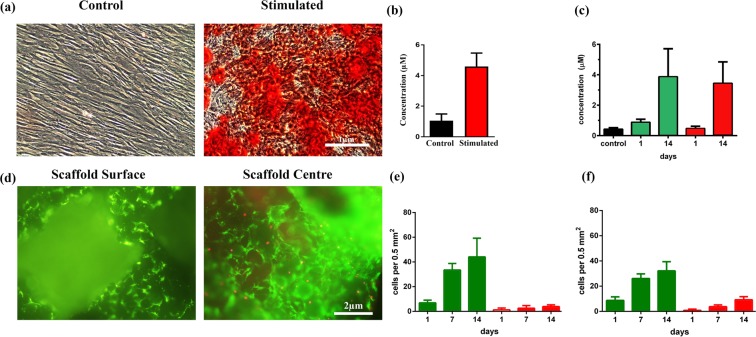
Alizarin Red and Live/Dead staining of pADSCs with quantification. pADSCs were cultured for 14 days in osteogenic differentiation medium in monolayer and on the scaffold. (a) Calcium deposition is shown as red colour by Alizarin Red staining of pADSCs cultured with or without osteogenic induction media (n = 3). Scale bar = 1 μm. (b) Quantification of the intensity of red colour in the monolayer (p < 0.0001). (c) Quantification of the intensity of red colour of Alizarin Red staining on the scaffold (surface vs. centre) at day 1 and day 14. Alizarin red staining reveals mineralized matrix both on the scaffold surface (green bars) and in the centre of the scaffolds (red bars, p = 0.53). (d) Cell viability by live/dead cell staining on TCP-PLGA scaffolds demonstrating the distribution of living (green) and dead (red) pADSCs on the surface vs. center. The green fluorescence represent living cells while red fluorescence indicate dead cells. (e) Quantification of ratio of living to dead cells on the scaffold surface where green represents the living cells and red represents the dead cells (p = 0.0225). (f) Quantification of ratio of living to dead cells in the scaffold center where green represents the living cells and red represents the dead cells (p < 0.0001). Scale bar = 2 μm. Data presented from 3 different pigs plated in triplicates.

