Figure 3.
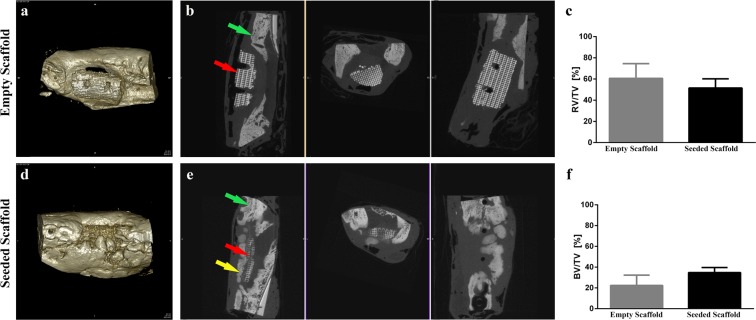
MicroCT (µCT) reconstructions and quantification of bone volume at 12 weeks after implantation in mandibular defects of minipig. (a) 3D reconstruction of the defect areas filled with the empty scaffold. (b) Transverse µCT of the defect area with the empty scaffold. (c) µCT quantification of the relative residual soft tissue volume to the total volume (RV/TV, p = 0.1766).). (d) 3D reconstruction of the defect areas filled with the pADSC-seeded scaffold. (e) Transverse µCT of the defect area with the pADSC-seeded scaffold. (f) µCT quantification of bone volume to the total volume of the former defect area (BV/TV, p < 0.05). Green arrows represent the bone of the mandible. Red arrows represent the scaffold implanted in the critical size mandibular defect. Yellow arrow represents de novo bone formation in the critical size mandibular defect.

