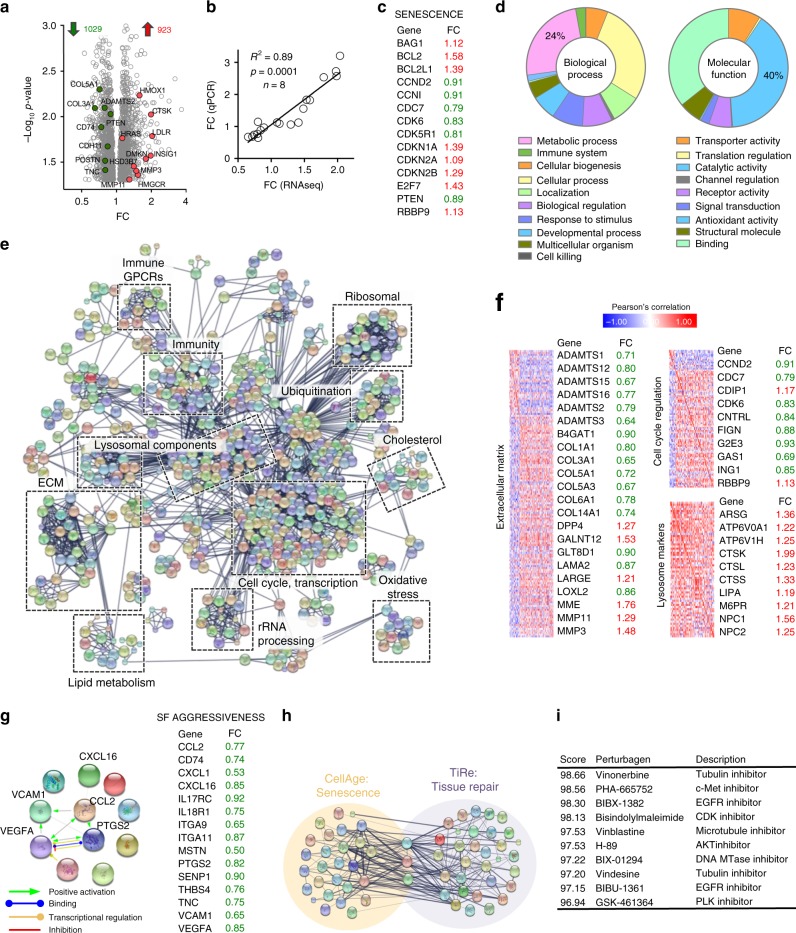
Fig. 3. Gene expression profile acquired during MC1-mediated cellular senescence.
a RNAseq analysis on SF (n = 8 patient cell lines) treated with 1 μM BMS, identified 1952 statistically significant (p < 0.05) differentially expressed genes which are presented as a volcano plot: fold change from BMS vs. control, against p value. Highlighted genes were validated by real-time PCR. b Nineteen genes (details in Supplementary Table 3) were selected for expression validation using SYBR Green real-time PCR and fold changes calculated as 2−ΔΔCt. Values obtained by both techniques are presented against each other. Data are mean ± SE (n = 8 SF cell, Pearson’s correlation). c Senescence-related genes significantly altered by BMS treatment and their differential expression value: up-regulated in red, down-regulated in green. d Functional profiling of all 1952 differentially expressed genes identified by RNAseq using Panther Classification System. e Protein–protein interaction (PPI) network built with all 1952 significantly altered genes using STRING. Further functional analysis was performed with DAVID and significantly enriched categories are highlighted. f Selected genes associated with biological functions of interest are shown with their respective expression values (up-regulated in red, down-regulated in green) together with a correlation matrix constructed with all genes in each category. g PPI network constructed with selected genes related to SF activation and aggressive phenotype. The fold changes of down-regulated genes (in green) induced by BMS are shown. h Genes related to senescence and tissue repair were retrieved from CellAge and TiRe databases, respectively, and a merged PPI network generated using STRING. i Connectivity map analysis shows positive association (i.e. positive score, maximum score can be 100) between the BMS-induced genes identified through our RNAseq analysis and the gene expression profiles induced by drugs included in the Connectivity Map database. Source data are provided as Source Data file.

