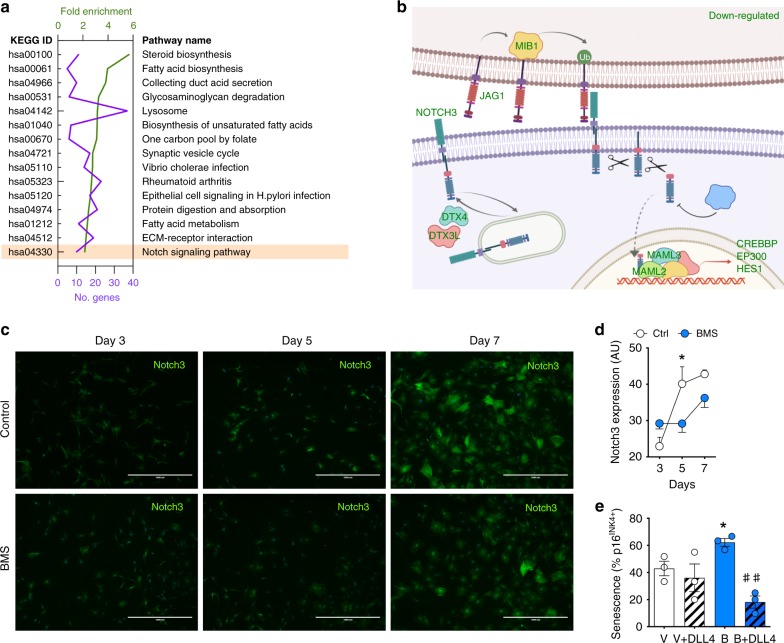
Fig. 4. Role of the Notch pathway in SF senescence induced by BMS.
a Analysis of KEGG pathways of all 1952 differentially expressed genes following treatment with BMS (1 µM; 7 days). Number of genes annotated to each pathway (purple) and fold enrichment (green) are shown for the top 15 pathways. The Notch pathway is highlighted. b Specific members of the Notch pathway down-regulated in BMS-treated SF (green); figure was created using BioRender. Additional genes are shown in Supplementary Table 3. c Visual expression of Notch3 protein as determined by immunofluorescence on SF with or without treatment with BMS (1 µM; 7 days). Scale bars indicate 1000 μm. d Quantification of Notch3 protein expression on SF with or without treatment with BMS (1 µM for 7 days; n = 3, one-way ANOVA vs. control, Ctrl; *p < 0.05). e SFs were treated with vehicle or 1 μM BMS, in the presence or absence of the recombinant Notch ligand DLL4 (5 μg/ml) for 7 days. Senescence was measured by p16INK4 staining by immunofluorescence and % of positive cells were quantified (n = 3, Student’s t-test compared to vehicle (V*) or to BMS (B#); *p < 0.05, ##p < 0.001). Source data are provided as Source Data file.

