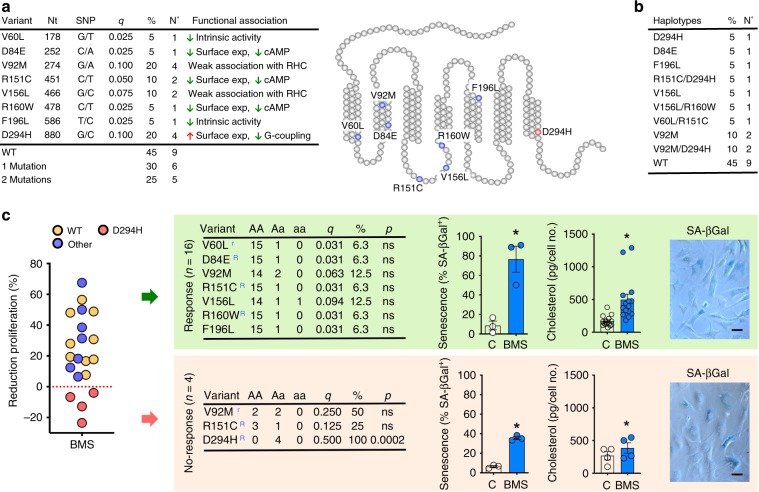
Fig. 7. Association of MC1R gene variants with induction of SF senescence.
a MC1R variants identified in our study participants. Table includes variant name, position of nucleotide changed (Nt), specific nucleotide change (SNP), variant allele frequency (q), percentage (%), and number of patients (No.) and functional outcome described in literature for each variant (n = 20 patients). The location of each variant within MC1 protein is shown in the scheme. b Percentage (%) and number (No.) of patients carrying each of the haplotypes identified (total n = 20). c Effect of BMS on proliferation of SF cell lines obtained from each of the 20 patients genotyped. Patient cells cluster into responders (n = 16, green panel) and non-responders (n = 4, yellow panel) according to the effect of BMS in the proliferation assay. For each group, the MC1R variant analysis is shown (A: consensus allele; a: variant allele; q: allele “a” frequency; %: proportion of allele “a” carriers; p: p value two-tailed Fisher’s test). Moreover, superscript R: high penetrance red hair variant; superscript r: weakly associated with red hair. Quantification and images of SA-βGal staining are shown for each group (scale bars indicate 100 μm) as well as cholesterol production measured by enzyme immunoassay. Data are mean ± SE (Student’s t-test vs. control, C, *p < 0.05). Source data are provided as Source Data file.

