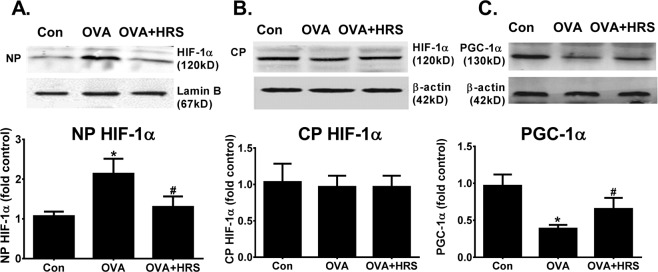
Figure 3.
H2 counter-regulates OVA sensitization and challenge-induced HIF-1α upregulation and PGC-1α downregulation. Mice in Con, OVA or OVA + HRS group were sensitized and challenged, and treated with HRS as described above. Lung tissue levels of hypoxia inducible factor (HIF)-1α and peroxisome proliferator-activated receptor-γ coactivator (PGC)-1α were analyzed. The Western blot HIF-1α or PGC-1α bands (upper panel) were quantified using densitometry and expressed as fold change over control group (bar graphs). Means ± SEM of 5 mice per group. *p < 0.05, compared to control group. #p < 0.05, compared to OVA group (one-way ANOVA). (A) Nuclear HIF-1α protein content. (B) Cytoplasmic HIF-1α protein content. (C) PGC-1α protein expression. NP, nuclear protein. CP, cytoplasmic protein. Cropped blots are displayed. The original blots are shown in Supplementary Fig. 1A–C.

