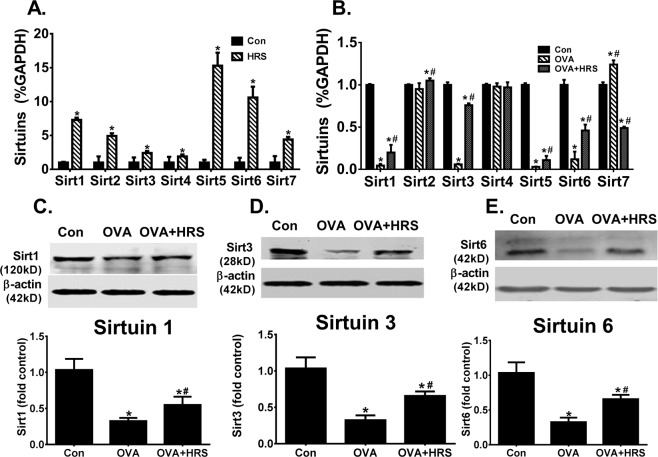
Figure 4.
H2 regulates sirtuin expression. Mice in Con, HRS, OVA or OVA + HRS group were sensitized and challenged, and treated with HRS as described above. Lung tissue levels of sirtuins (Sirt) 1, 2, 3, 4, 5, 6 and 7 mRNA expression were quantified by qRT-PCR and expressed as sirtuin/GAPDH (glyceraldehyde 3-phosphate dehydrogenase) ratio, or lungs tissue levels of sirtuins 1, 3 and 6 proteins were quantified by Western blots. Means ± SEM of 5 mice per group. *p < 0.05, compared to control group. #p < 0.05, compared to OVA group (unpaired t test or one-way ANOVA). (A) Sirtuin mRNA expression in control lungs. (B) Sirtuin mRNA expression in OVA-sensitized and challenged lungs. (C–E) Sirtuins 1, 3 and 6 protein expression in OVA-sensitized and challenged lungs. The Western blot bands (upper panel) were quantified using densitometry and expressed as fold change over control group (bar graphs). Cropped blots are displayed. The original blots are shown in Supplementary Fig. 2A–C.

