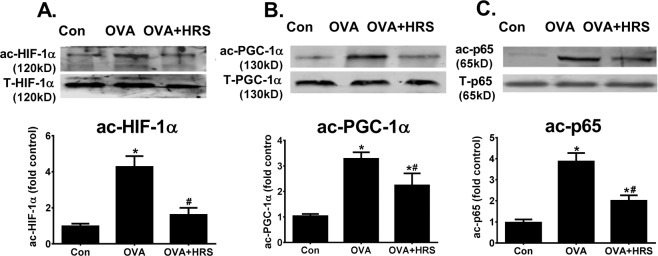
Figure 5.
H2 inhibits OVA sensitization and challenge-induced HIF-1α, PGC-1α and p65 acetylation. Mice in Con, OVA or OVA + HRS group were sensitized and challenged, and treated with HRS as described above. Lung tissue levels of total (T-HIF-1α, T-PGC-1α and T-p65) and acetylated (ac-HIF-1α, ac-PGC-1α and ac-p65) HIF-1α, PGC-1α and NF-κB p65 were quantified by Western blots. Means ± SEM of 5 mice per group. *p < 0.05, compared to control group. #p < 0.05, compared to OVA group (one-way ANOVA). (A–C) Lung tissue levels of total and acetylated HIF-1α, PGC-1α and p65 protein. The ac-HIF-1α, ac-PGC-1α and ac-p65 bands were quantified using densitometry and expressed as fold change over control group. Cropped blots are displayed. The original blots are shown in Supplementary Fig. 3A–C.

