FIGURE 4.
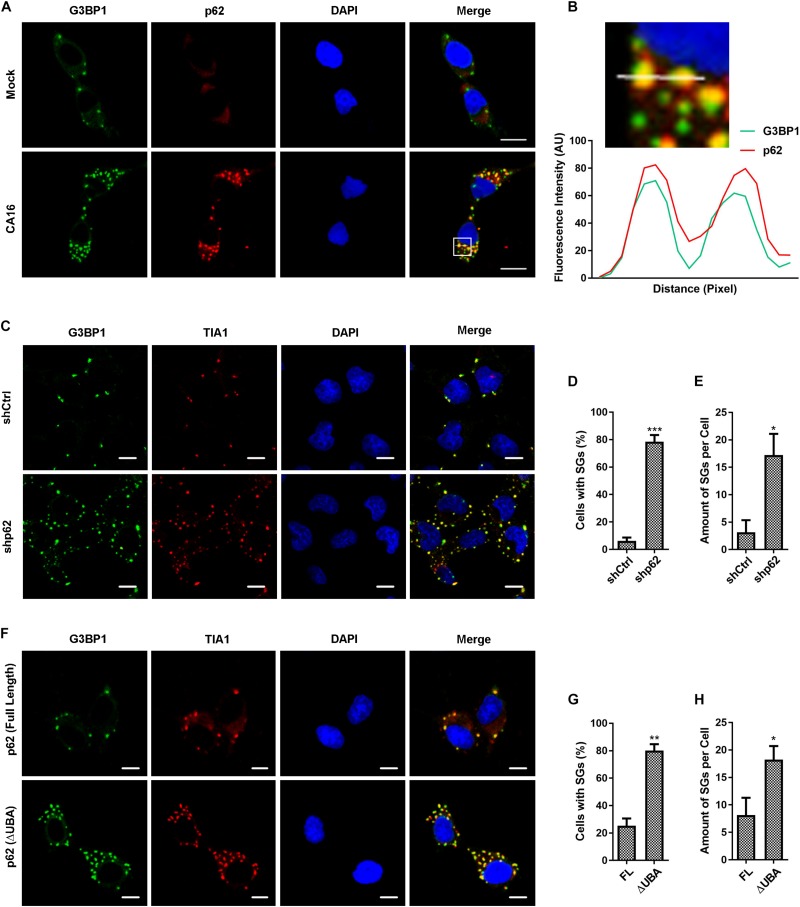
p62 mediated autophagic clearance of SGs in CA16-infected cells. (A) RD cells were subjected to CA16 infection at an MOI of 1 or mock infection for 4 h. The dissemination of G3PB1 and p62 was detected by fluorescence microscopy. Representative images are shown. Scale bars, 5 μm. (B) The white box (inset) shows the zoomed image. The fluorescence intensity of G3BP1 and p62 along the indicated line were scanned. Their colocalization was determined by using the Pearson correlation coefficient method (r = 0.83). (C) p62-deficient RD cells (shp62) or control RD cells (shCtrl) were infected with CA16 at an MOI of 1 for 24 h. (F) p62-deficient RD cells transduced with full-length human p62 (FL) or p62 (ΔUBA, Δ404aa-425aa) constructs were subjected to CA16 infection at an MOI of 1 for 24 h. (C) and (F) SGs were examined by fluorescence microscopy (G3BP1 and TIA1 serve as SG markers). Representative images of stress granules are shown. Scale bars, 5 μm. (D) and (E) Quantitation of the data in (C). (G) and (H) Quantitation of the data in (F). Graphs show the mean ± SEM, 6 random fields and 10 cells per field were examined for confocal microscopy. *p < 0.05; **p < 0.01; ***p < 0.001.

