
Figure 1. Vaccination of carrier‐coupled poly‐GA peptides induces high‐titer anti‐GA antibodies.
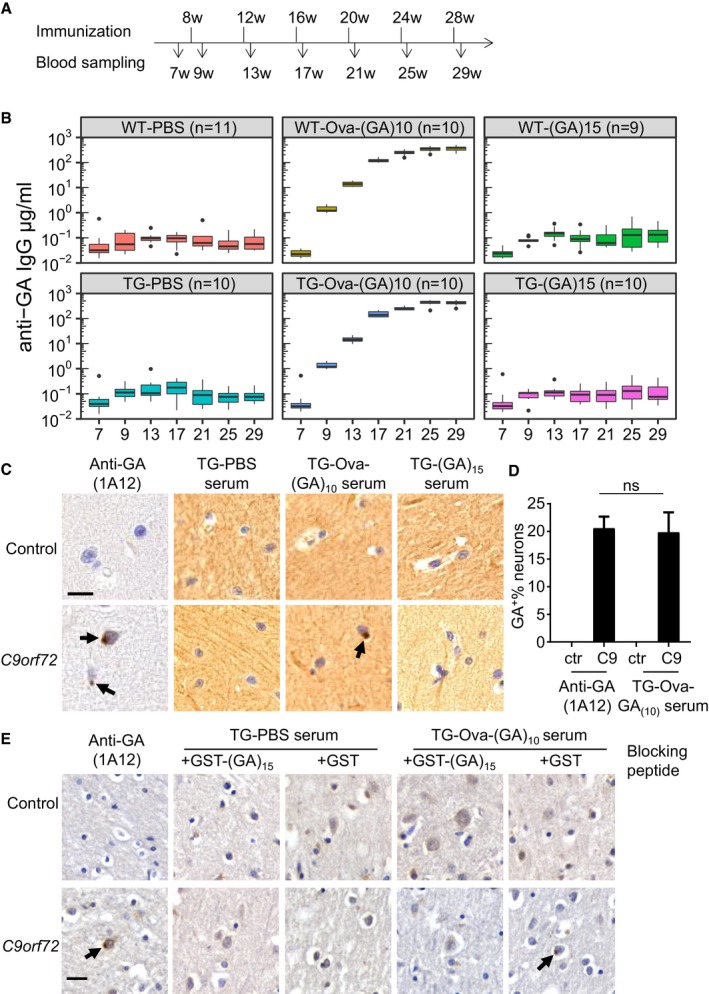
- Experimental paradigm for vaccination of GA‐CFP mice and wild‐type littermates.
- Anti‐GA response in vaccinated mice measured by ELISA using GST‐(GA)15 antigen. Tukey‐style box plot shows 25th, 50th, and 75th percentiles, and whiskers extend to ± 1.5 interquartile range. Outliers depicted as dots. Number of mice per group as indicated. Two‐way repeated‐measure ANOVA (group x time) revealed a significant main effect of treatment (F 5,57 = 478.2, P < 0.0001) and time (F 6,342 = 296.1, P < 0.0001) and a significant interaction between factors (F 30,342 = 119.5, P < 0.0001), followed by Tukey's post hoc test. P‐values are indicated in Appendix Table S1.
- Immunohistochemistry of sections from a C9orf72 patient and a healthy control. Monoclonal anti‐GA and antiserum from Ova‐GA‐vaccinated mice detect neuronal cytoplasmic inclusions (arrows) in the molecular layer of the cerebellum. Note that crude antiserum shows higher background than the monoclonal antibody. Scale bar indicates 20 μm.
- Quantitative analysis for poly‐GA‐positive inclusions per 100 neurons in (C). Bar graphs represents mean ± SD from 6 images. One‐way ANOVA, Tukey's post hoc test, F 3,15 = 2.676, P = 0.0846, C9: anti‐GA 1A12 vs. C9: TG‐Ova‐(GA)10 serum P = 0.9483.
- Immunohistochemistry of sections from occipital cortex of a C9orf72 patient and a healthy control with monoclonal anti‐GA and antiserum preincubated with 0.1 mg/ml recombinant GST‐(GA)15 or GST. Scale bar indicates 20 μm. Arrows depict poly‐GA positive inclusions.