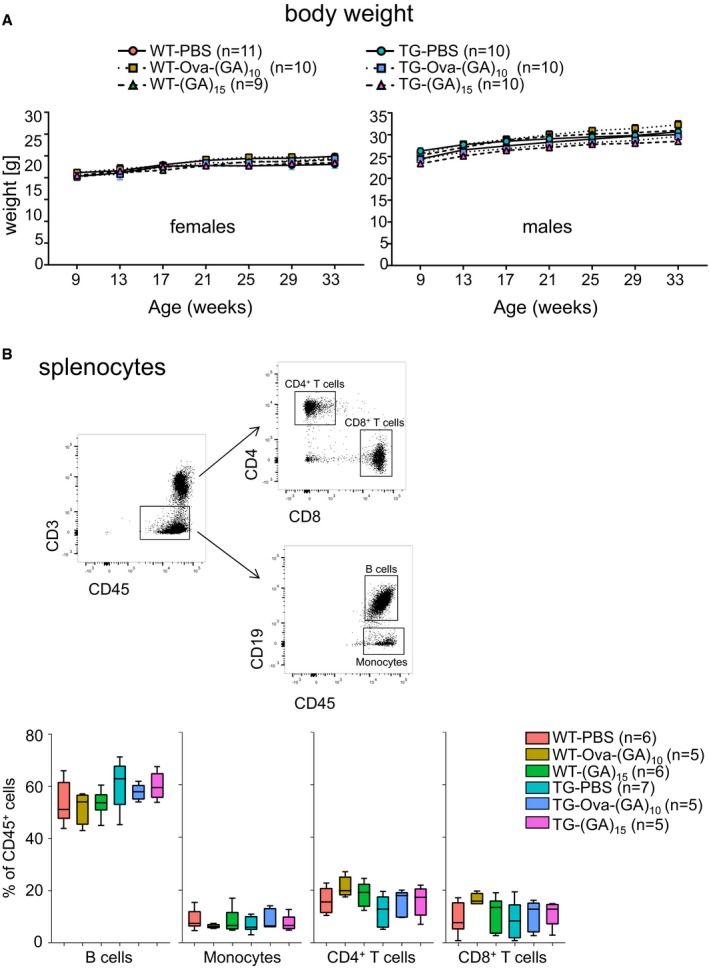
Figure EV1. Immunization regimen caused no overt side effects in mice.

- Body weight curve of vaccinated female mice (left panel) and male mice (right panel) on a standard diet. Number of mice per group as indicated. Two‐way repeated‐measure ANOVA (group × time) revealed a non‐significant main effect of group (females: F 2,13 = 0.3747, P = 0.6947; males: F 2,11 = 3.042, P = 0.0888) and significant effect of time (females: F 5,65 = 13.28, P < 0.0001; males: F 5,55 = 102.6, P < 0.0001) and a non‐significant interaction between factors (females: F 10,65 = 0.8671, P = 0.5678; males: F 10,55 = 1.067, P = 0.4030), followed by Tukey's post hoc test.
- Leukocyte distribution in the spleen measured by flow cytometry at 32 weeks of age, n = 5–7 mice per group as indicated. Gating of the different cell populations is shown in a representative scatter plot. Tukey‐style box plot shows 25th, 50th, and 75th percentiles, and whiskers extend to ± 1.5 interquartile range. One‐way ANOVA and Tukey's post hoc revealed no significant changes in the frequency of different cell subtypes. B cells: P = 0.4962; monocytes: P = 0.8126; CD4 T cells: P = 0.9443; CD8 T cells: P = 0.6648.
