
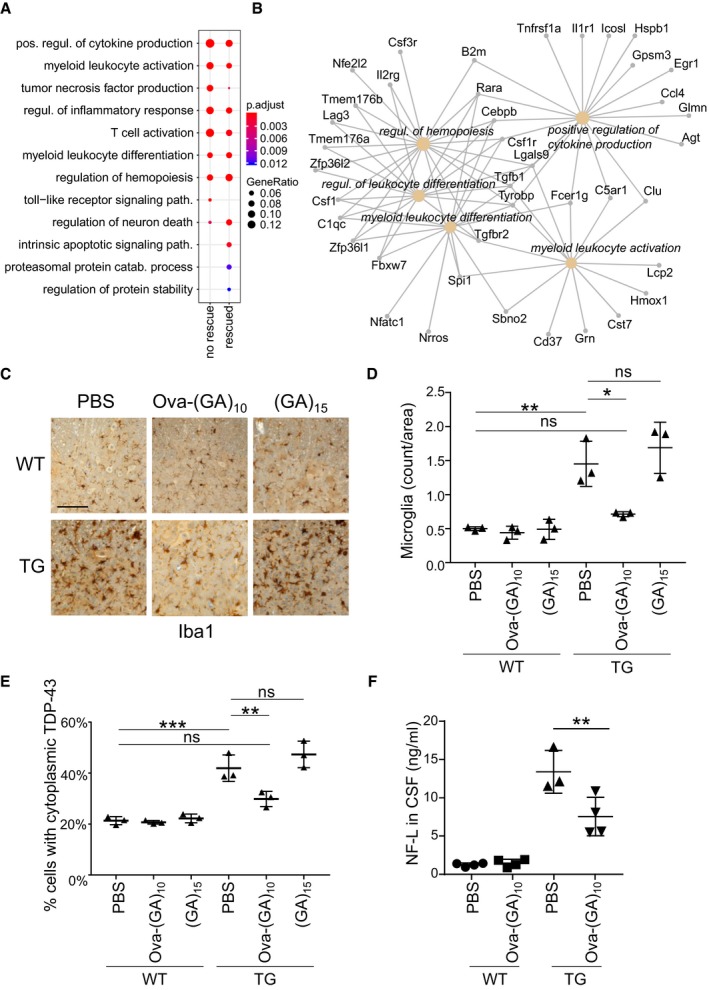
Figure 3. Ova‐GA immunization prevents microglia/macrophage activation, TDP‐43 mislocalization, and neuroaxonal damage.
-
AGene ontology analysis of differentially expressed genes in TG‐PBS mice comparing genes significantly rescued by Ova‐(GA)10 immunization and non‐rescued genes (absolute log2‐fold change > 0.585, compare Datasets EV1, EV2, EV3 and EV4). The dot size and color represent the fraction of the differentially expressed genes in each category and adjusted P‐values, respectively. Mouse number as indicated in Fig 1B.
-
BNetwork of the genes dysregulated in TG‐PBS and significantly rescued in TG‐Ova‐(GA)10.
-
C, DAnalysis of microglia/macrophage activation using Iba1 immunohistochemistry from complete spinal cord sections at 1‐mm interval. Dot plot represents mean ± SD from n = 3 animals per group. One‐way ANOVA, Tukey's post hoc test. **P < 0.01, *P < 0.05, ns not significant. Scale bar indicates 100 μm. F 5,12 = 0.6974, P = 0.6357; TG‐Ova‐(GA)10 vs. TG‐PBS P = 0.0131; TG‐(GA)15 vs. TG‐PBS P = 0.7650. TG‐PBS vs. WT‐PBS P = 0.0018.
-
EThe percentage of cells with partial cytoplasmic mislocalization of TDP‐43 (compare Fig EV5E) was quantified from six images from spinal cord sections at 1‐mm intervals. Dot plot represents mean ± SD from n = 3 animals per group. One‐way ANOVA, Tukey's post hoc test. **P < 0.01, ***P < 0.001, ns not significant. F 5,12 = 0.6533, P = 0.6650; TG‐Ova‐(GA)10 vs. TG‐PBS P = 0.0096; TG‐(GA)15 vs. TG‐PBS P = 0.4215.
-
FImmunoassay of NFL level in cerebrospinal fluid. Dot plot represents mean ± SD from n = 4 animals per group. One‐way ANOVA, Tukey's post hoc test, F 3,11 = 1.911, P = 0.1862. **P < 0.01. TG‐Ova‐(GA)10 vs. TG‐PBS P = 0.0081.
Source data are available online for this figure.