Fig. 2.
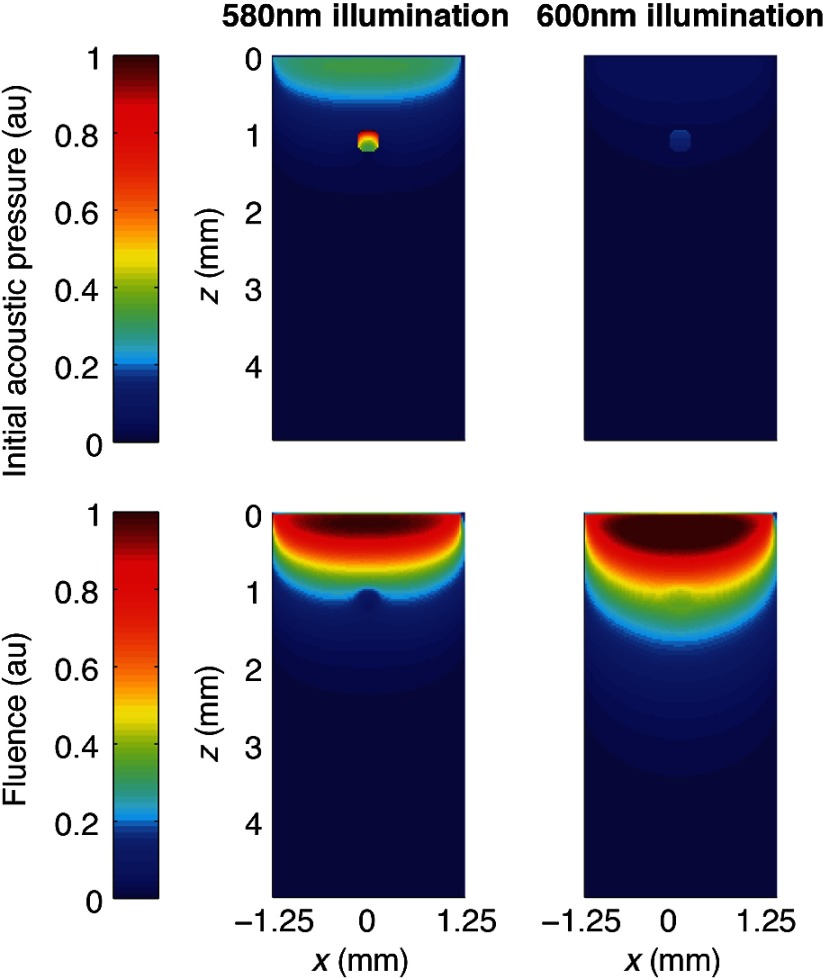
Spectral coloring. Top row: MIP of initial acoustic pressure in tube phantom with spectrally varying background illuminated with top hat profile at 580 and 600 nm, normalized by maximum acoustic pressure value. Bottom row: MIP of fluence in tube phantom with spectrally varying background illuminated with top hat profile at 580 and 600 nm, normalized by maximum fluence value.

