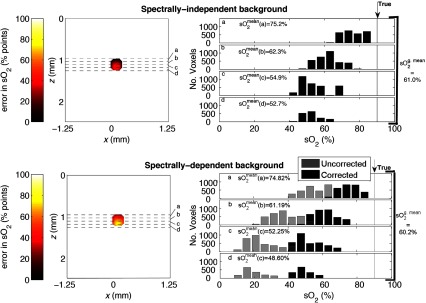
Fig. 3.
estimates using 26 wavelengths between 500 and 1000 nm. Top row: slice of error in oxygenation midway along tube’s length when the background is spectrally flat and the error originates from spectral coloring of the fluence in the blood-filled tube. Dashed lines used to indicate four slices (a–d) from which histograms of are formed (true value of 90% indicated by black line). Bottom row: slice of error in oxygenation midway along tube’s length when the background optical properties vary with wavelength. Both the cases with and without a depth-dependent fluence correction are shown. Dashed lines used to indicate four slices (a–d) from which histograms of are formed (true value of 90% indicated by vertical black line). (a–d) represent the mean of the estimates of the voxels contained within the tube in slices a, b, c, and d, respectively, for the corrected data. The global mean of the corrected data, which represents estimates averaged over all voxels enclosed within the entire tube, is shown to the right of the histograms.

