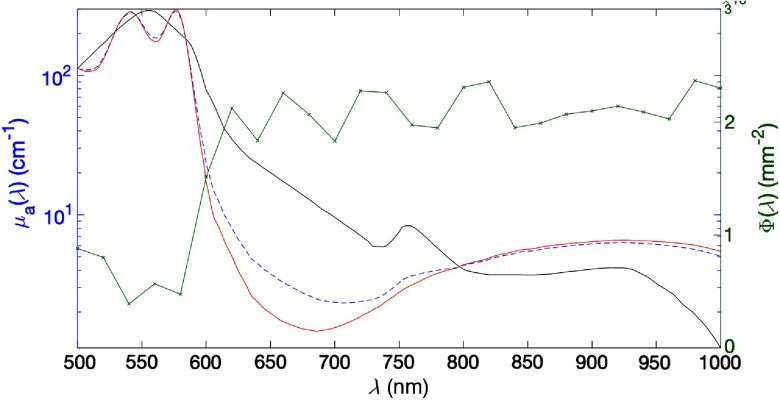
Fig. 4.
Plot of absorption spectrum in the tube (dashed blue) for 90% oxygenated blood and average fluence spectrum (green) in the tube. Also shown are the spectra for fully oxygenated blood (red) and deoxygenated blood (black). Fluence simulated using MC with photons, collimated, illuminated 2.5 mm in diameter at wavelengths in 500- to 1000-nm range, and averaged over tube volume.

