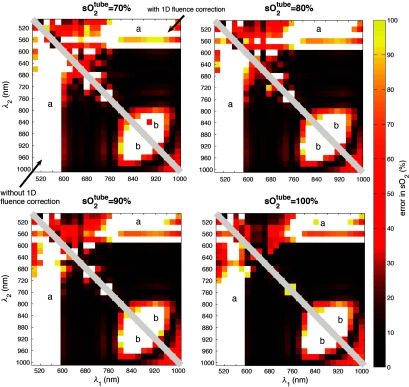
Fig. 6.
Matrix of average error in oxygenation for 26 wavelength pair combinations in 500- to 1000-nm range for different values of oxygenation in the tube, . In each figure, the bottom-left triangle represents estimates made with a spectrally varying background and the top-right triangle represent estimates made with a spectrally varying background using a depth-dependent fluence correction. The white pixels represent estimates with an error . In the regions marked “a,” this error is due to spectral coloring; in the regions marked “b,” it is due to poor conditioning. Top left: . Top right: . Bottom left: . Bottom right: .

