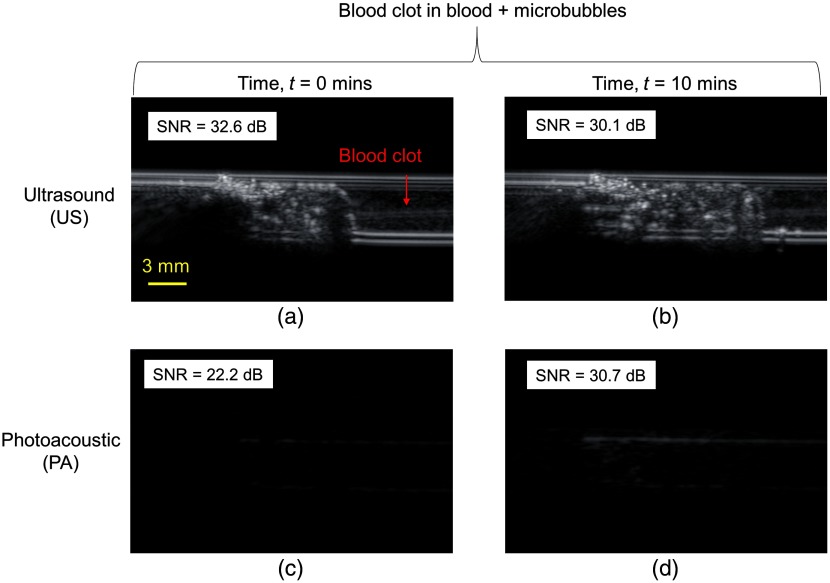
Fig. 5.
In vitro images on the eCube system obtained from US and PAPA imaging modes where (a) and (c) show the blood clot in a tube filled with blood + microbubbles at time before sonothrombolysis and (b) and (d) show the same blood clot after time of sonothrombolysis. The SNRs are shown for each figure.

