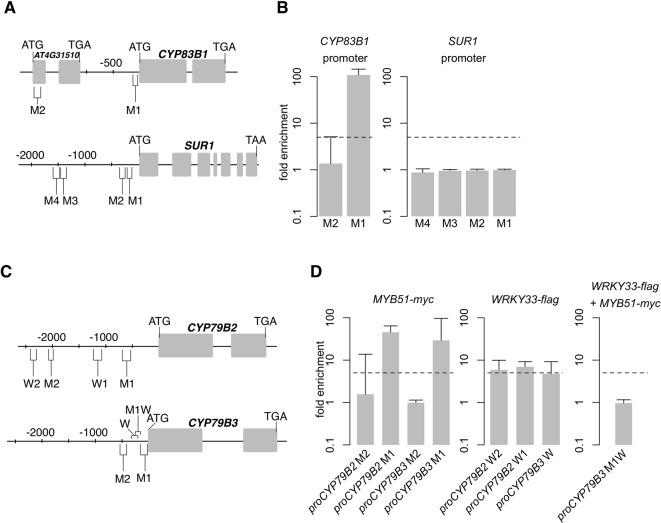
Figure 4.
MYB51 and WRKY33 interaction with CYP83B1, CYP79B2, and CYP79B3 promoters. (A–D) Nucleotide positions (A, C), ChIP-PCR analysis (B, D, left and middle), and sequential chromatin immunoprecipitation (ChIP)–PCR analysis (D, right) of secondary wall MYB-responsive element (SMRE) (M), W-box (W), and SMRE and W-box (MW)–containing promoter (pro) regions bound by MYB51-myc and/or WRKY33-flag in 9-day-old seedlings co-elicited with 20 μM Dex or mock solution (0.5% DMSO) and Psta for 9 h. Boxes in (A, C) indicate exons. Dashed lines in (B, D) represent the fivefold cutoff between weak and strong transcription factor (TF)–DNA interactions. Data in (B–D) represent median ± SE of three (D, right) and four (B; D, left and middle) biological replicates, each containing approximately 200 seedlings. Fold enrichment was determined by calculating the ratio of PCR product intensities in ChIP Dex/Mock to Input Dex/Mock. Experiments were performed twice, producing similar results.

