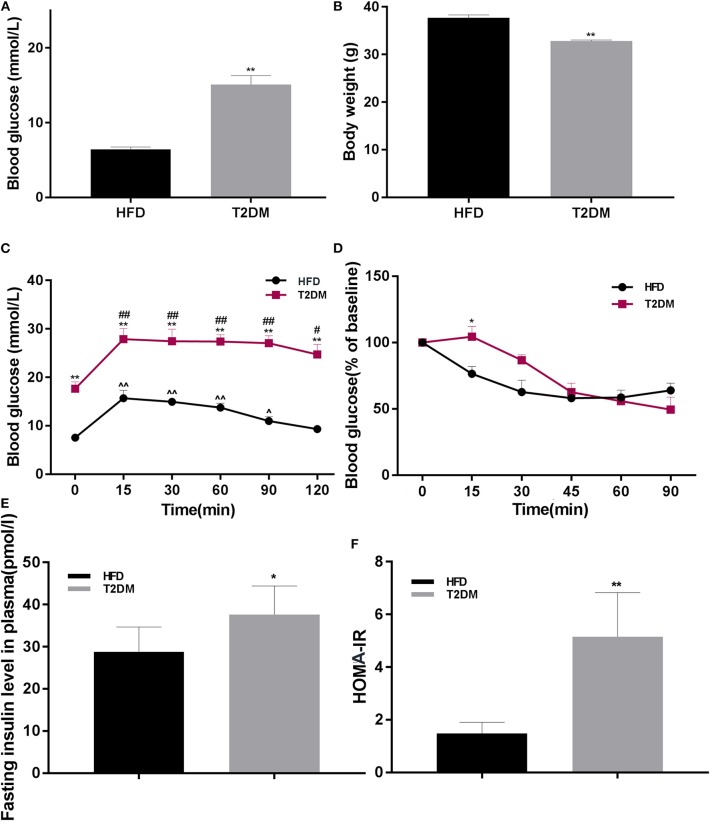
Figure 2.
The differences between HFD and T2DM mice in terms of blood glucose levels, body weight, OGTT, ITT, insulin concentration, and HOMA-IR. (A) Blood glucose in HFD and T2DM mice under 12-h fasting conditions after successful induction of diabetes. (B) Changes in body weight over 46 days. (C) Oral glucose tolerance tests (OGTT) in mice fed with high-fat diet. (D) Insulin tolerance tests (ITT) in HFD and T2DM mice. (E) Insulin concentration and (F) HOMA-IR values between HFD and T2DM mice. Data are presented as means ± SEM (HFD: n = 13; T2DM: n = 15). *P < 0.05, **P < 0.01 (compared with HFD group), #P < 0.05, ##p < 0.01 (compared with 0 min blood glucose in T2DM group), and ∧P < 0.05, ∧∧P < 0.01 (compared with 0 min blood glucose in HFD group).

