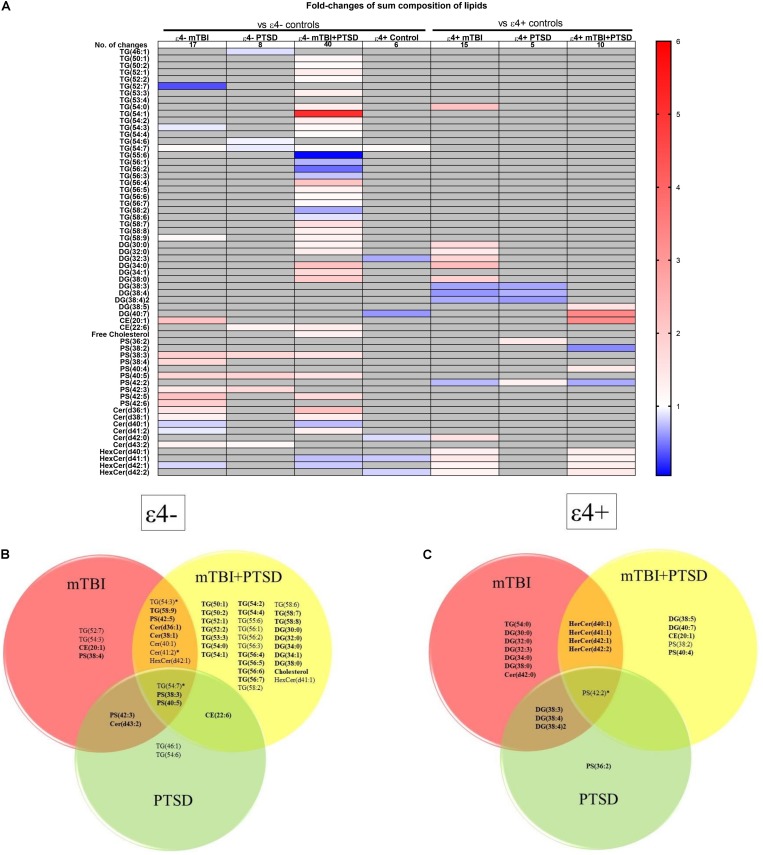
FIGURE 3.
Liquid chromatography-mass spectrometry examination of peripheral levels of sum composition lipids in mTBI, PTSD and mTBI + PTSD in individuals with and without the ε4 allele. (A) Heatmap of fold change of lipids that were significantly altered compared to their ε4− and ε4+ respective controls. (B) Venn diagram of sum composition lipids altered in ε4− diagnostic groups compared to their control. (C) Venn diagram of sum composition lipids altered in ε4+ diagnostic groups compared to their control. Statistical analyses; MLM with LSD post hoc and B–H correction, p ≤ 0.05 cut-off. TG, Triglycerides; DG, Diglycerides; CE, Cholesterol esters; PS, Phosphatidylserines; Cer, Ceramides; HexCer, Hexosylceramides. DG(34:2)2 indicates a second peak integrated separately for that lipid. In Venn diagrams bolded lipids indicate an increase compared to controls while non-bolded indicates a decrease. Lipids marked by an asterisk indicate this lipid is increased in a group and decreased in another.

