Figure 3.

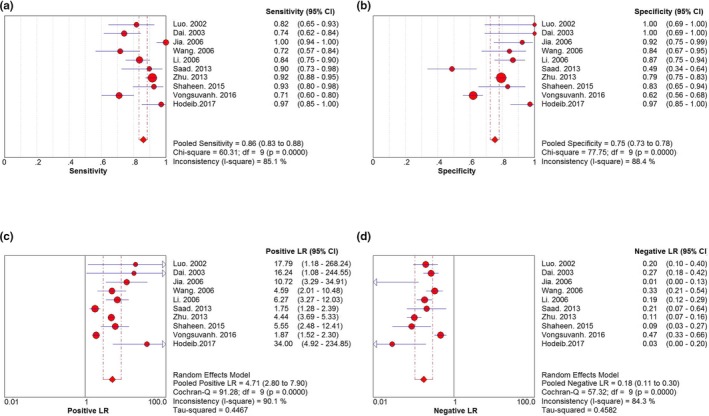
Forest plots of the meta‐analysis of (a) sensitivity, (b) specifcity, (c) PLR, and (d) NLR. PLR, positive likelihood ratio; NLR, negative likelihood ratio

Forest plots of the meta‐analysis of (a) sensitivity, (b) specifcity, (c) PLR, and (d) NLR. PLR, positive likelihood ratio; NLR, negative likelihood ratio