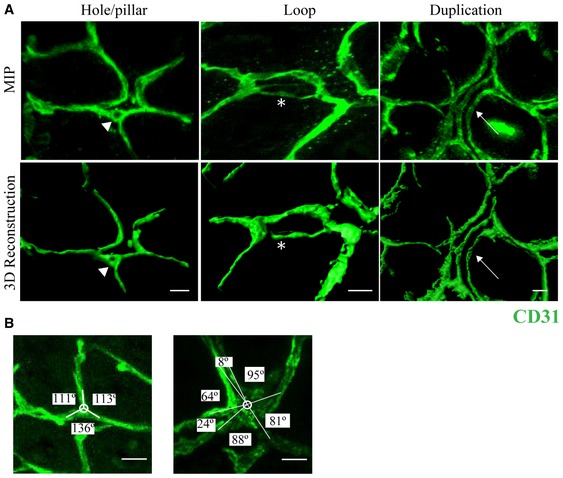
Figure EV2. Visualization of intussusceptive angiogenesis hallmarks in mouse colitis by confocal microscopy and 3D‐image rendering.

-
ARepresentative maximum‐intensity projection (MIP) images of mucosal plexus in whole‐mount distal colon stained for CD31 (green) from a MT1f/f mouse treated with 1% DSS for 3 days (upper row). 3D rendering of the raw images was performed with Imaris® (lower panels). Holes, loops, and duplications are visible and indicated by arrowhead, asterisk, and arrow, respectively. Scale bar, 10 μm.
-
BMagnified view of a tri‐corner in the colon mucosal plexus (left) and a splitting corner after 3 days of 1% DSS (right), illustrating quantification of the intercapillary angles (Ackermann et al, 2013). Scale bar, 10 μm.
