-
A
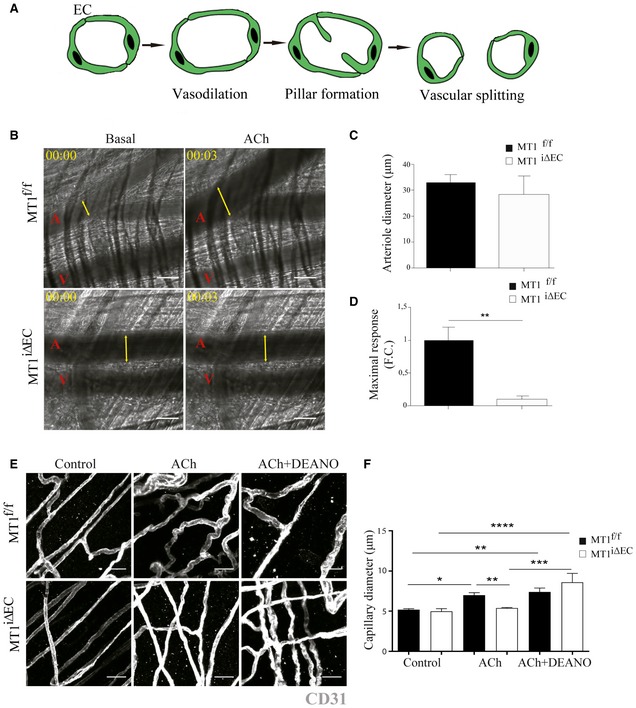
Scheme showing IA process including vasodilatation, pillar formation, and vascular splitting. EC, endothelial cell.
-
B
Representative intravital microscopy images of cremaster muscle from MT1f/f or MT1iΔEC mice before and 15 min after i.v. injection of 100 μl of 100 μM acetylcholine (ACh). A and V mark arterioles and venules, respectively, and yellow arrows indicate arteriole diameter. Elapsed time is designated as hh:mm. Scale bar, 30 μm.
-
C, D
Cremaster arteriole diameter in basal conditions (C) and the maximum vasodilation response (diameter fold change) after 3 min of ACh stimulation (D); n = 5–6 mice per genotype. Data are shown as mean ± SEM and were tested by paired t‐test; **P < 0.01.
-
E
Representative images of staining for CD31 (gray) in whole‐mount cremaster muscle dissected from MT1f/f or MT1iΔEC mice before and 15 min after i.v. injection of 100 μl of 100 μM ACh alone or in combination with DEANO (100 μl of 10−4 M). Scale bar, 25 μm.
-
F
Quantification of capillary diameter in mice analyzed as in (E); n = 5–8 mice per genotype and condition. Data are shown as mean ± SEM and were tested by one‐way ANOVA with Benjamini and Hochberg post‐test; *P < 0.05, **P < 0.01, ***P < 0.001, ****P < 0.0001.
‐values.

