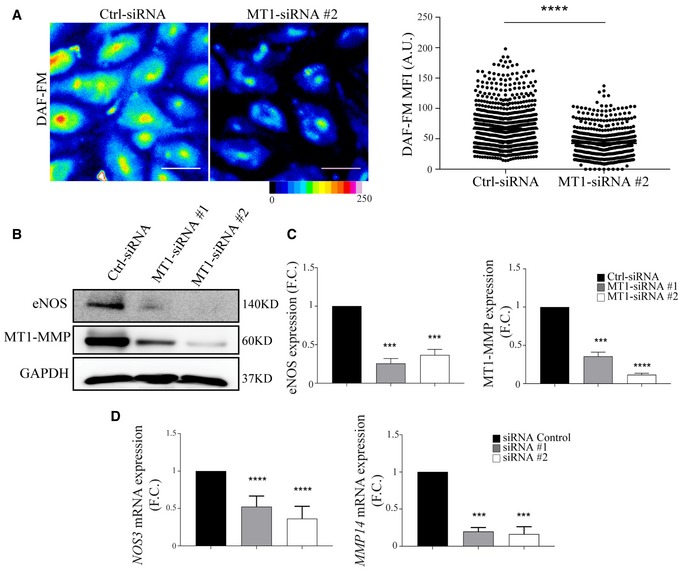
Figure 4. Decreased nitric oxide production and eNOS expression in MT1‐MMP‐silenced human endothelial cells.

-
ARepresentative pseudo‐colored microscopy images of DAF‐FM (4‐amino‐5‐methylamino‐2′,7′‐difluorofluorescein diacetate) fluorescence intensity in human endothelial cells (HUVEC) expressing control or MT1‐MMP siRNA (left); scale bar, 50 μm. The graph to the right shows DAF‐FM mean fluorescence intensity (MFI) values obtained in n = 637–879 cells analyzed per condition in six independent experiments. Data are shown as individual cell values and mean ± SEM and were tested by the Mann–Whitney test; ****P < 0.0001.
-
B, CRepresentative Western blot of eNOS and MT1‐MMP in HUVEC expressing control or different MT1‐MMP siRNAs; GAPDH is included as a loading control (B). Bar graphs (C) show relative eNOS and MT1‐MMP expression (vs. GAPDH); n = 5 independent experiments. Data are shown as mean ± SEM and were tested by one‐sample t‐test; ***P < 0.001, ****P < 0.0001.
-
DqPCR analysis of relative eNOS (NOS3) and MT1‐MMP (MMP14) mRNA levels in HUVEC expressing control or MT1‐MMP siRNAs; n = 4 independent experiments. F.C., fold change. Data are shown as mean ± SEM and were tested by one‐sample t‐test; ***P < 0.001, ****P < 0.0001.
