-
A
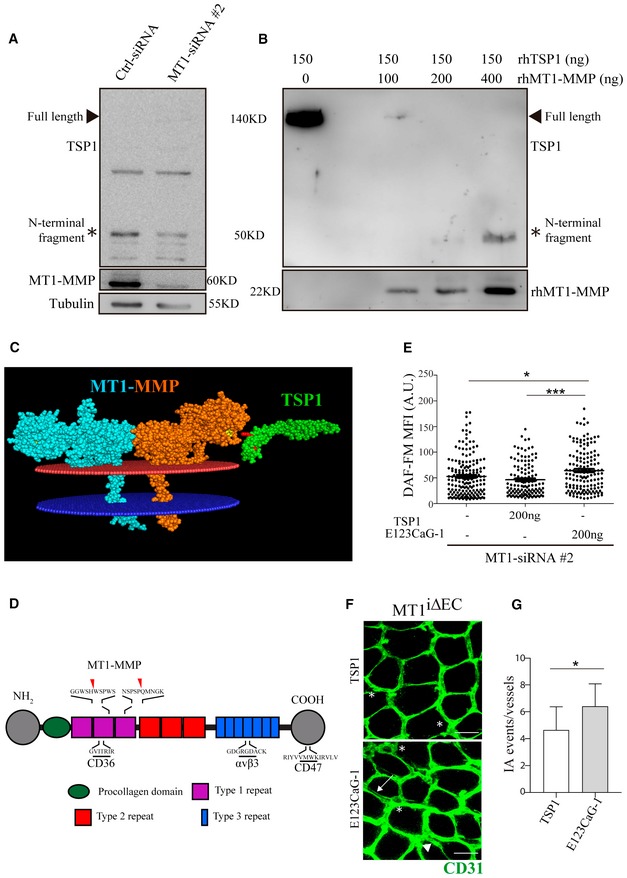
Western blot of TSP1 expression (developed with an antibody against an epitope nearby the N‐terminus; Lee
et al,
2006) in lysates from siCtrl and siMT1‐silenced HUVEC. MT1‐MMP and tubulin are included as silencing and loading controls, respectively. The arrowhead marks full‐length TSP1 and the asterisk the N‐terminal TSP1 fragment.
-
B
Western blot of in vitro digested TSP1 (developed with the same antibody as in A) incubated with increasing amounts of recombinant human MT1‐MMP catalytic domain. rhMT1‐MMP catalytic domain is also included. The arrowhead marks full‐length TSP1 and the asterisk the N‐terminal TSP1 fragment generated by MT1‐MMP cleavage.
-
C
In silico model of the membrane‐anchored MT1‐MMP dimer (blue/orange) and TSP1 type 1 repeat domains 2 and 3 (green). Yellow marks the catalytic pocket in the MT1‐MMP protease, and red indicates the two selected cleavage sites in TSP1.
-
D
Scheme depicting the TSP1 domain structure with the binding sequences to CD36, CD47, and αvβ3 integrin, as well as the positions of the identified cleavage sites for MT1‐MMP.
-
E
DAF‐FM mean fluorescence intensity (MFI) in HUVEC expressing MT1‐MMP siRNA and left untreated or treated with 200 ng of full‐length TSP1 or the E123CaG‐1 fragment; n = 128–184 cells analyzed per condition in two independent experiments. Data are shown as individual cell values and mean ± SEM and were tested by the Kruskal–Wallis test; *P < 0.05, ***P < 0.001.
-
F
Representative maximum‐intensity projection images of CD31 staining (green) in whole‐mount colon mucosal plexus of MT1f/f mice injected intraperitoneally with 1 μg full‐length TSP1 or the E123CaG‐1 fragment at day 0 and day 2 during 1% DSS treatment for 3 days. Scale bar, 40 μm. Arrows, arrowheads, and asterisks indicate duplications, loops, and pillars, respectively; n = 6 and 7 mice per condition in two independent experiments.
-
G
Quantification of IA events in mice treated as in (F). Data are shown as mean ± SEM and were tested by t‐test; *P < 0.05.
‐values.

