-
A
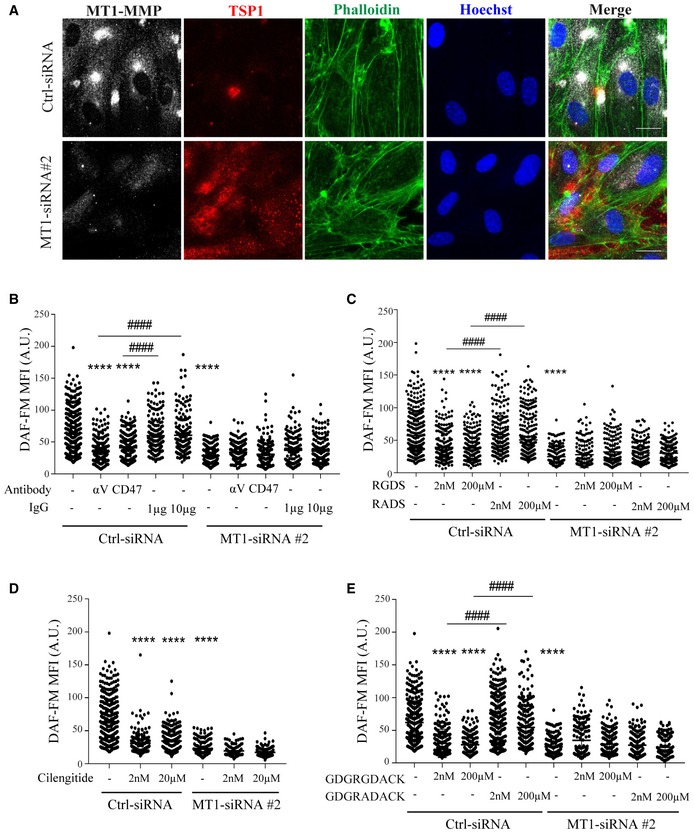
Representative maximum‐intensity projection images of HUVEC expressing control or MT1‐MMP siRNA and stained for MT1‐MMP (gray), TSP1 (red), and F‐actin (phalloidin, green); nuclei are stained with Hoechst (blue). Scale bar, 20 μm.
-
B
DAF‐FM mean fluorescence intensity (MFI) in HUVEC expressing control or MT1‐MMP siRNA and left untreated or treated with blocking anti‐CD47 or anti‐αv integrin antibodies (1 and 10 μg/ml, respectively, for 24 h) or their corresponding IgG isotype controls (IgG); n = 149–360 cells analyzed per condition in three independent experiments.
-
C
DAF‐FM mean fluorescence intensity (MFI) in HUVEC expressing control or MT1‐MMP siRNA and left untreated or treated with 2 nM or 200 μM RGDS or its control peptide RADS; n = 147–385 cells analyzed per condition in three independent experiments.
-
D
DAF‐FM mean fluorescence intensity (MFI) in HUVEC expressing control or MT1‐MMP siRNA and left untreated or treated with 2 nM or 20 μM of the RGD cyclic peptide cilengitide; n = 100–360 cells analyzed per condition in three independent experiments.
-
E
DAF‐FM mean fluorescence intensity (MFI) in HUVEC expressing control or MT1‐MMP siRNA and left untreated or treated with 2 nM or 200 μM of the nonamer GDGRGDACK or its control peptide GDGRADACK; n = 149–337 cells analyzed per condition in three independent experiments.
Data information: Data are shown in all panels as individual cell values and mean ± SEM and were tested by the Kruskal–Wallis test; ****
P < 0.0001,
####
P < 0.0001. * indicates comparison with Ctrl‐siRNA, and # indicates comparison of the condition with its corresponding control. Please see
Appendix Table S3 for exact
P‐values.
Source data are available online for this figure.

