-
A
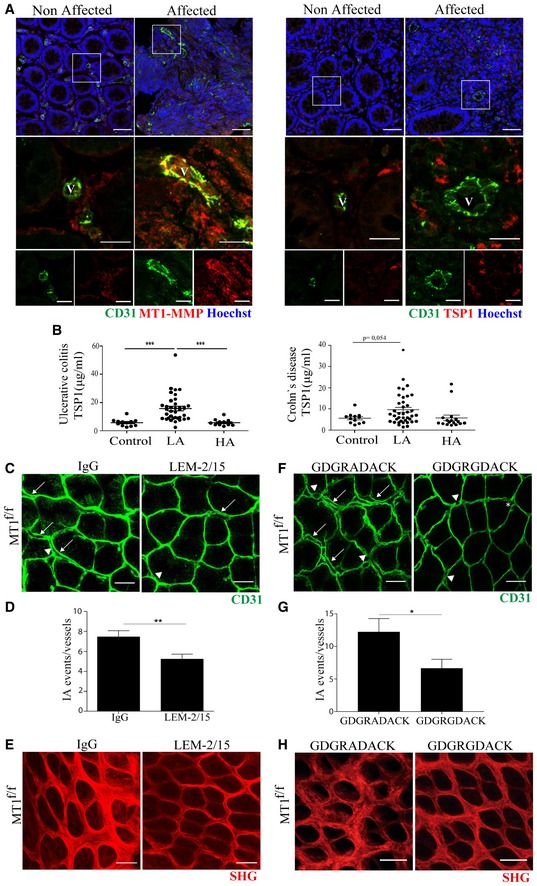
Representative maximum‐intensity projection images of staining for CD31 (green), MT1‐MMP or TSP1 (red), and Hoechst (blue, nuclei) in colon sections obtained from an IBD patient. Boxed areas are shown in magnified views below with merged images of green and red channels in the middle and single channels to the bottom. Non‐affected and affected mucosa areas from the same patient are shown for comparison. Scale bar, 50 μm (upper panel) and 20 μm (magnified views). V, vessel.
-
B
ELISA analysis of serum TSP1 in healthy individuals and patients affected by ulcerative colitis (left) or Crohn's disease (right). n = 12–37 individuals per condition. LA and HA indicate patients with low and high active disease based on clinical score. Data are shown as individual values and mean ± SEM and were tested by one‐way ANOVA with Benjamini and Hochberg post‐test; ***P < 0.001.
-
C
Representative maximum‐intensity projection images of CD31 staining (green) in whole‐mount colon mucosal plexus of MT1f/f mice injected intraperitoneally with 3 mg/kg of the anti‐MT1‐MMP inhibitory antibody LEM‐2/15 or its isotype control at day 0 and day 2 during the 3 days of treatment with 1% DSS. Scale bar, 40 μm. Arrows, arrowheads, and asterisks indicate duplications, loops, and pillars, respectively.
-
D
Quantification of IA events in mice treated as in (C); n = 8 mice per condition in two independent experiments. Data are shown as mean ± SEM and were tested by t‐test; **P < 0.01.
-
E
Representative second‐harmonic generation (SHG) microscopy images of whole‐mount colons from MT1f/f mice treated as in (C). Scale bar, 40 μm.
-
F
Representative maximum‐intensity projection images of CD31 staining (green) in whole‐mount colon mucosal plexus of MT1f/f mice treated with the TSP1 nonamer GDGRGDACK or its control peptide GDGRADACK by continuous minipump delivery (up to 2.4 mg/mouse/day) for 3 days during 1% DSS treatment. Scale bar, 40 μm. Arrows, arrowheads, and asterisks indicate duplications, loops, and pillars, respectively. Mice/n independent experiments.
-
G
Quantification of IA events in mice treated as in (F); n = 5 and 6 mice per condition in two independent experiments. Data are shown as mean ± SEM and were tested by t‐test; *P < 0.05.
-
H
Representative second‐harmonic generation (SHG) microscopy images of whole‐mount colons from MT1f/f mice treated as in (F). Scale bar, 40 μm.
‐values.

