-
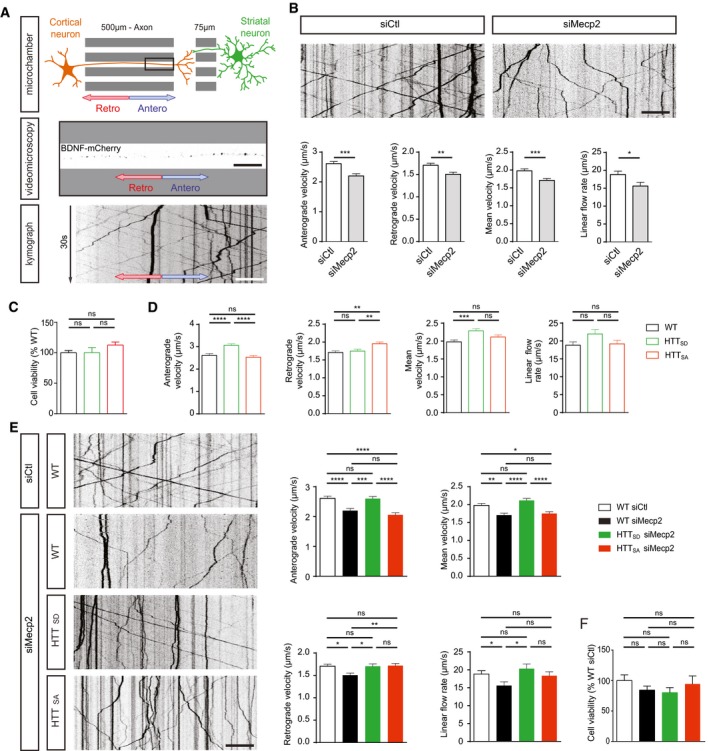
A
Microchamber that allows the isolation of axons within a corticostriatal network and live‐cell imaging of axonal BDNF‐mCherry transduced into mouse primary cortical neurons.
-
B
Representative kymographs and quantification of anterograde, retrograde, mean velocity, and linear flow rate of BDNF‐mCherry‐containing vesicles in cortical neurons transfected with siMecp2 (n = 753 vesicles/81 axons) or siControl (siCtl) (n = 894 vesicles/94 axons), inducing significant silencing of Mecp2 (3 independent experiments; unpaired t‐test).
-
C
Quantification of anterograde, retrograde, mean velocity, and linear flow rate of BDNF‐mCherry trafficking into cortical neurons obtained from WT (n = 753 vesicles/81 axons), HTTSA (n = 812 vesicles/81 axons), or HTTSD (n = 787 vesicles/82 axons) homozygous knock‐in mice in which S421 of HTT was replaced by an alanine (HTT
S421A/S421A or HTTSA), mimicking the absence of phosphorylation, or by an aspartic acid (HTT
S421D/S421D or HTTSD), mimicking constitutive phosphorylation (3 independent experiments; one‐way ANOVA test with Tukey's multiple comparisons).
-
D
Cell viability in WT (n = 3), HTTSA (n = 1), or HTTSD (n = 2) neurons measured by MTT assay. No differences were observed between the different groups (three independent experiments; one‐way ANOVA Kruskal–Wallis test, P = 0.5701)
-
E
Kymographs and quantification of anterograde, retrograde, mean velocity, and linear flow rate of BDNF‐mCherry axonal trafficking into WT (n = 894 vesicles/94 axons), HTTSA (n = 812 vesicles/82 axons), or HTTSD (n = 787 vesicles/94 axons) cortical neurons transfected with siCtl or siMecp2, which significantly silenced Mecp2 (three independent experiments; one‐way ANOVA with Tukey's multiple comparisons).
-
F
Cell viability in WT, HTTSA, or HTTSD neurons transfected with siCtl or siMecp2 measured by MTT assay (WT siCtl: n = 3; WT siMecp2: n = 3; HTTSD siMecp2: n = 3; HTTSA siMecp2: n = 2). No differences were observed between the different groups (three independent experiments; one‐way ANOVA Kruskal–Wallis test, P = 0.5701).
Data information: Scale bars = 20 µm. *
< 0.0001, ns = not significant. Data are presented as the means ± SEM.