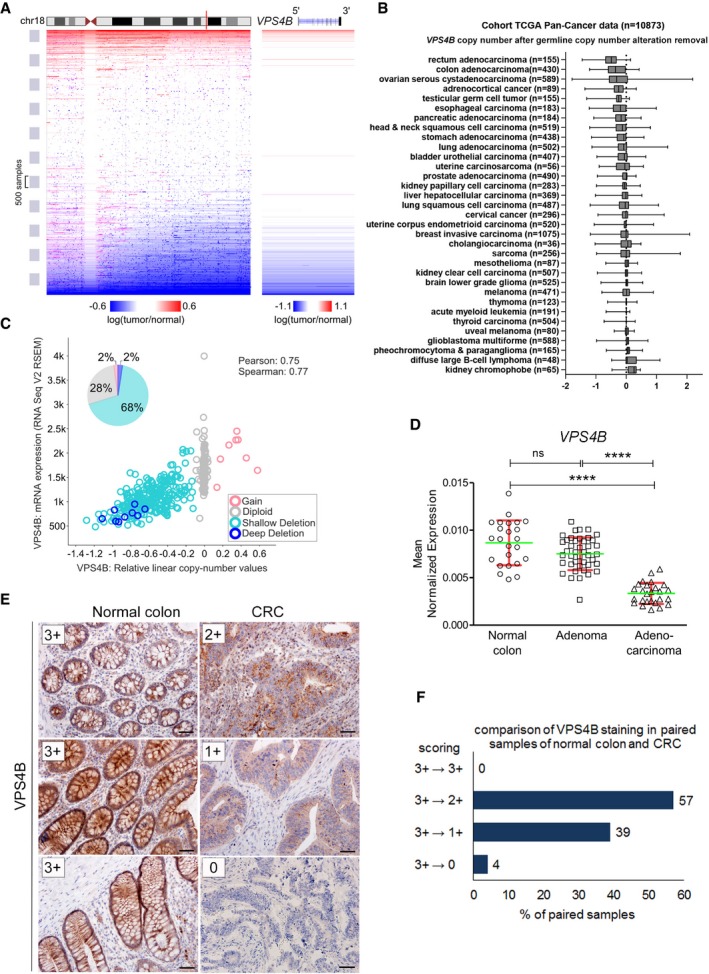
Figure 1. Expression of VPS4B is downregulated in CRC .

-
ALeft panel, a scheme of chromosome 18 copy number alterations depicting the distal long arm loss across TCGA Pan‐Cancer dataset. Vertical red line indicates the localization of VPS4B. Right panel, enlarged fragment of chromosome 18 showing frequent deletions of VPSB locus in cancer samples. Deletions are marked in blue, and amplified regions are marked in red. Both panels were generated with UCSC Xena browser (https://www.biorxiv.org/content/10.1101/326470v3).
-
BAnalysis of VPS4B copy number alterations in TCGA Pan‐Cancer dataset. Cancer types were sorted according to the mean VPS4B copy number after removing germline values. The boxes denote the 25th to 75th percentile range, and the center lines mark the 50th percentile (median). The whiskers reflect the largest and smallest observed values. VPS4B copy number alteration data were fetched using UCSC Xena browser.
-
CScatter plot, analysis of VPS4B mRNA expression (number of transcripts per million) plotted against VPS4B copy number from TCGA CRC patient samples (n = 376); plot generated using cBioPortal (Gao et al, 2013). Pie chart, summary of all types of VPS4B copy number alterations based on the analysis of data from 615 CRC samples deposited in the Colorectal Adenocarcinoma (TCGA, Provisional) dataset on cBioPortal (http://www.cbioportal.org/).
-
DqPCR analysis of VPS4B mRNA abundance in normal colon, adenoma, and CRC samples. Adenocarcinoma (n = 26); adenoma (n = 42); normal colon (n = 24). Green horizontal bars indicate means, and red whiskers indicate SD. Differences were analyzed using the Kruskal–Wallis test followed by Dunn's multiple comparison post hoc test; ns—non‐significant (P ≥ 0.05), ****P < 0.0001.
-
EExamples of immunohistochemical staining of VPS4B in normal colon and matched CRC samples as an illustration of the scoring system used for the evaluation presented in (F). 3+—very intensive staining, 2+—medium‐intensive staining, 1+—weak staining, 0—no staining. Scale bar, 50 μm.
-
FComparative analysis of VPS4B staining performed in 100 pairs of normal colon and matched CRC samples.
