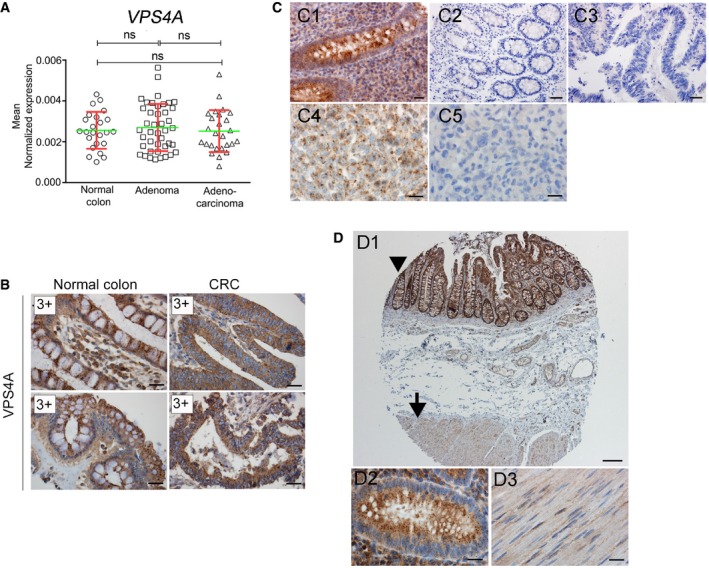
Figure EV1. Evaluation of VPS4A and VPS4B protein abundance in human tissues and in CRC .

-
AqPCR analysis of VPS4A mRNA abundance in normal colon, adenoma, and CRC samples. Adenocarcinoma (n = 26); adenoma (n = 42); normal colon (n = 24). Green horizontal bars indicate means, and red whiskers indicate SD. Differences were analyzed using the Kruskal–Wallis test followed by Dunn's multiple comparison post hoc test; ns—non‐significant (P ≥ 0.05).
-
BImmunohistochemistry (IHC) evaluation of VPS4A abundance in pairs of normal colon versus matched CRC samples (2 representative pairs out of 100 analyzed). 3+—very intensive staining. Scale bar, 20 μm.
-
CSpecificity tests of VPS4B IHC staining using human tissues and mouse xenografts. C1—strong granular cytoplasmic staining in the mucosa of the appendix. C2, C3—negative staining in the appendix (C2) and CRC (C3) when primary antibody (anti‐VPS4B) was omitted. C4—granular cytoplasmic staining in the xenograft from wild‐type (VPS4B +/+) HCT116 cells. C5—negative staining in the xenograft from HCT116 VPS4B −/− cells. Scale bars: C1, C4, and C5—20 μm; C2, C3—50 μm.
-
DSpecificity tests of VPS4A IHC staining in various human tissues with high and low expression of VPS4A. D1—strong granular cytoplasmic staining in the mucosa of the appendix (arrowhead, and at a higher magnification in D2) and weak staining in the muscle (arrow, and at a higher magnification in D3). Scale bars: D1—200 μm; D2 and D3—20 μm.
