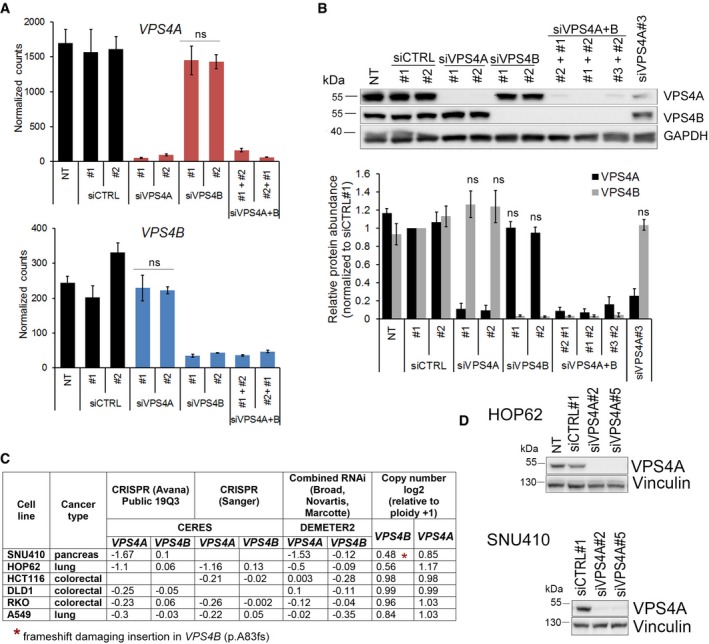
Figure EV2. Analyses of VPS4A and VPS4B mRNA and protein abundance in HCT116 cells and the dependencies between both genes in different cell lines.

-
AmRNA levels of VPS4A (upper panel) and VPS4B (lower panel) in HCT116 cells 72 h upon siRNA transfection. For VPS4A or VPS4B depletion, two different duplexes (#1 or #2) of siVPS4A or siVPS4B were used. For simultaneous VPS4A+B depletion, various combinations of siVPS4A and siVPS4B duplexes were used. Two different duplexes of siCTRL (#1 or #2) were used as non‐targeting controls. NT—non‐transfected. Values represent normalized counts after including variance normalized transformation performed by the DESeq2 package for RNA‐Seq data analysis. Data are means of four independent experiments ± SEM. Two‐tailed unpaired t‐test; ns—non‐significant (P ≥ 0.05).
-
BUpper panel, representative immunoblotting analysis of VPS4A and VPS4B abundance in lysates of HCT116 cells collected 72 h after transfection as in (A). GAPDH was used as a loading control. Lower panel, densitometry analysis of VPS4A and VPS4B abundance based on immunoblotting analysis as shown in the upper panel. NT—non‐transfected. Data are means of four independent experiments ± SEM. Wilcoxon signed rank test; ns—non‐significant (P ≥ 0.05).
-
CCorrelation between dependency scores and VPS4B copy number for selected cancer cell lines from the DepMap portal dataset (https://depmap.org/portal/). According to the portal, a lower score (below −0.5) means that a gene is more likely to be dependent in a given cell line. A score of 0 is equivalent to a gene that is not essential, whereas a score of −1 corresponds to the median of all common essential genes.
-
DImmunoblotting analysis of VPS4A silencing efficiency in HOP62 and SNU410 cell lines. Lysates were prepared 6 days after siRNA transfection with non‐targeting (siCTRL#1) or VPS4A‐targeting (siVPS4A#2 or #5) duplexes. Vinculin was used as a loading control.
