-
A, B
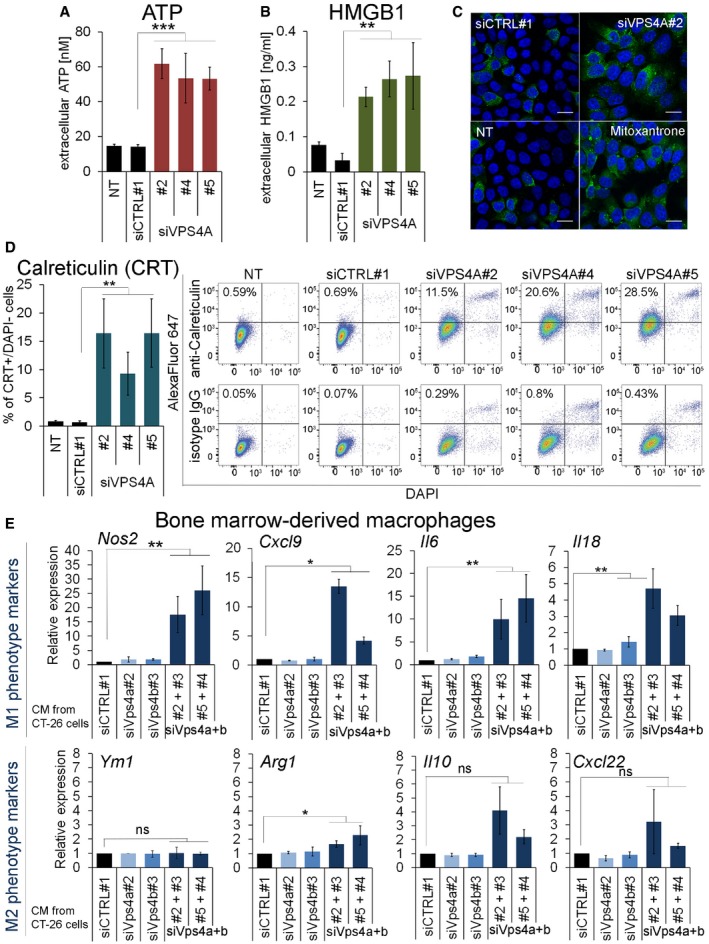
Measurement of ATP (A) and HMGB1 (B) released to the cell medium by HCT116 VPS4B
−/− cells non‐transfected (NT) or transfected with siRNA (non‐targeting siCTRL#1 or targeting siVPS4A duplexes: #2, #4, or #5). Cell culture media were exchanged 16 h after transfection, and fresh media were conditioned for the next 52‐58 h. For non‐transfected cells (NT), the same treatment protocol was used but without the transfection mixture. Data are means of five (A) or four (B) independent experiments ± SEM. Two‐tailed unpaired t‐test; **P < 0.01, ***P < 0.001.
-
C
Microscopy images presenting cell surface calreticulin (green) in HCT116 VPS4B
−/− cells 48 h after transfection with siRNA (non‐targeting siCTRL#1 or targeting siVPS4A#2). As a positive control for detection of cell surface calreticulin, non‐transfected cells (NT) were treated with 2 μM mitoxantrone for 24 h. In blue, DAPI staining. Scale bar, 15 μm.
-
D
Flow cytometric analysis of calreticulin exposed on the cell surface of VPS4A‐depleted HCT116 VPS4B
−/− cells 66 h after siRNA transfection (siVPS4A duplexes: #2, #4, or #5 were used). Non‐transfected (NT) or siCTRL#1‐transfected cells served as negative controls. Left panel, percentage of cells positive for calreticulin in the population of live (DAPI‐negative) cells, data are means of four independent experiments ± SEM. The Mann–Whitney U‐test; **P < 0.01. Right panel, representative dot plot diagrams of flow cytometric analysis of cell surface‐exposed calreticulin. Primary rabbit anti‐calreticulin and control isotype IgG antibodies were used for staining, followed by secondary AlexaFluor 647‐conjugated antibody.
-
E
qPCR analysis of M1 (pro‐inflammatory) and M2 (anti‐inflammatory) macrophage polarization markers in mouse bone marrow‐derived macrophages (BMDMs) incubated for 24 h in conditioned media (CM) collected from control (siCTRL#1), Vps4a‐ and/or Vps4b‐depleted CT‐26 cells. For double Vps4a+b depletion, various combinations of siVps4a#2 or #5 and siVps4B#3 or #4 duplexes were used. Data were normalized and are presented as the fold change of expression of a given M1 or M2 marker in BMDMs treated with CM from Vps4‐depleted cells compared to its expression in BMDMs treated with CM from siCTRL#1‐transfected cells (set as 1). Data are means of four independent experiments ± SEM. One‐sample t‐test; ns—non‐significant (P ≥ 0.05), *P < 0.05, **P < 0.01.
‐values can be found in the source data for this figure.

