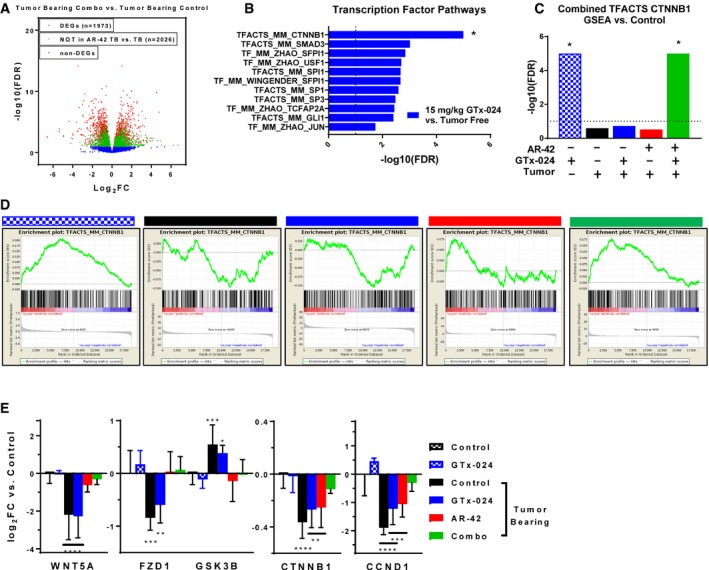
Figure 8. Transcriptomic analyses of GTx‐024's anabolic effects in skeletal muscle.

-
AVolcano plot from RNA‐seq analyses of Study 1 gastrocnemius muscles for tumor‐bearing combination‐treated mice versus tumor‐bearing controls. Genes not differentially expressed in this comparison are indicated in blue. The remaining genes (red and green) are DEGs in the combination‐treated versus tumor‐bearing control comparison. The green coloring indicates the subset of these DEGs that are not also differentially expressed in the comparison of AR‐42‐treated tumor‐bearing mice versus tumor‐bearing controls, suggesting these genes are responsive to only the combination therapy. Log2‐transformed fold change (FC) in expression is plotted on the x‐axis, and ‐log10‐transformed Benjamini–Hochberg‐adjusted P‐values are plotted on the y‐axis.
-
BSignificance values from transcription factor pathway‐focused GSEA of GTx‐024‐treated tumor‐free versus tumor‐free control transcriptomes. *FDR < 1e‐5 was determined for the CTNNB1 gene set and was set to 1e‐5 for the plot.
-
CSignificance values from GSEA using combined CTNNB1 gene sets. Each treatment group was compared to tumor‐free control transcriptomes. *FDR < 1e‐5 determined, set to 1e‐5 for plot.
-
DEnrichment plots from GSEA of the CTNNB1 gene set for each treatment group versus tumor‐free control comparisons. GTx‐024‐treated tumor‐free (blue checkered), tumor‐bearing control (black), GTx‐024‐treated tumor‐bearing (blue), AR‐42‐treated tumor‐bearing (red), and combination‐treated tumor‐bearing (green) groups.
-
EmRNA expression of WNT effectors upstream of β‐catenin. Data are presented as mean ± SD of log‐transformed fold‐change (log2FC) values versus tumor‐free controls. Groups: Tumor‐free control (n = 6), tumor‐free GTx‐024‐treated (n = 5), and tumor‐bearing groups receiving vehicle (n = 4), GTx‐024 (n = 5), AR‐42 (n = 5), or combination (n = 6). *P < 0.1, **P < 0.05, ***P < 0.01, ****P < 0.001 based on Benjamini–Hochberg‐adjusted P‐values from DESeq2. Exact P‐values provided in Appendix Table S8.
